Merkle released its Digital Marketing Report for Quarter 2, this week. We elaborate some of the key findings from the report in this post.
You can download the entire report from here.
1. Spend on Paid search increased in this quarter
Paid search spending across paid search platforms (AdWords, Bing Ads, Gemini) increased by 20% YoY from 15% growth in Q1. Specifically, AdWords spending rose 23% in Q2 from 21% in the last quarter and the majority of the ad spend has been accounted by mobile and PLA. Mobile spending outpaced desktop spending at 64% while desktop rose to 22%. While the spend increased the CPCs witnessed a decline as a result of the ad rank change announcement as shown in the next point.
2. Ad Rank calculation change affects CPC growth
Google’s update to Ad Rank thresholds has impacted the Brand Keyword CPC’s. While the ad spend remained flat, the clicks rose 9% and CPC dropped to 8% YoY and 14% in the month of June. The non-brand CPCs did not appear to have been impacted by the Ad Rank changes as their CPCs are likely to be more affected as a result of the competition and not minimum ad ranks.
3. Expanded Text Ads gain impressions
Data shows that ETAs share of impressions has increased to 74% ever since the option of creating standard ads was removed. However, it is analyzed that the CTR it has managed to garner in all these months is significantly lower than that of standard ads.
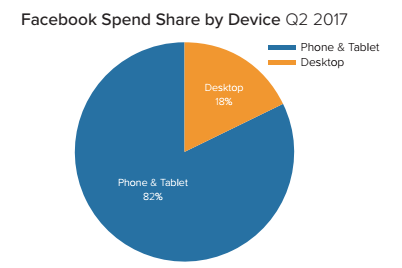
4. Facebook is growing as an advertising platform
Facebook has witnessed an increase in their advertising spend by 56% YoY this quarter and the CPM has seen a significant growth at 57%. Of this spend, Phones and Tablets accounted for 82% of the advertising spend in Q2 and the remaining 18% was attributed to Desktop. Phones and Tablet shares has observed a growth from 76% in Q1.
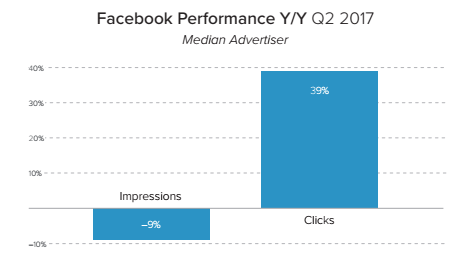
Though overall the clicks have increased from this advertising platform at 39% in Q2, the impressions saw a decline at about 9% YoY in Q2.
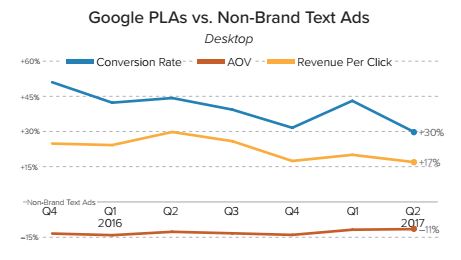
5. PLAs on the rise
Spend on Product Listing Ads or Google Shopping grew by 31% YoY in comparison to 16% of text ads. When comparing the desktop results of PLAs vs Text Ads, PLAs appeared to produce 30% higher conversions rates. Though the average order value from PLA was observed to be lower than text ads, the revenue generated from it was up by 17%.
Also, during this phase, European Commission fined Google for breaches in Google Shopping, however still PLAs accounted for 51% of retailers search ad clicks in the UK market . Proof enough of its growing pace.
Related Links:

Stop the wasted ad spend. Get more conversions from the same ad budget.
Our customers save over $16 Million per year on Google and Amazon Ads.