An audit of your PPC account ensures that all the loopholes are covered up and required actionable steps are taken to improve the overall performance.
Karooya’s Free Audit Report helps meet that objective. Of the many aspects it covers it also helps evaluate your quality score. Lets have a look at what it covers and how important it is.
What is Quality Score?
Quality Score is an important component that determines how much you pay for a click on your ad and how well your ad ranks on the search engine results.
Quality score is estimated by the following:
- Ad Relevance
- Expected CTR
- Landing Page Experience
Why is it important to audit Quality Score?
Driving focus on Quality Score on a regular basis ensures the following:
- Improved keyword targeting
- Driving relevant traffic
- Reducing the overall cost
- Improved Ad Ranking
- High Click Through Rates
What is Quality Score Report?
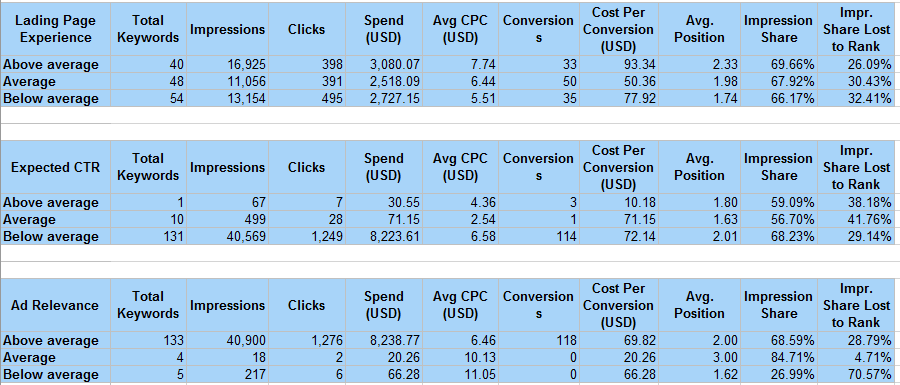
The report segregates account’s performance basis Quality Score components (Expected CTR, Landing Page Experience and Ad Relevance). For each component the following data is shared:
- Data of keywords being ranked as above average, average and below average
- Key metrics summary (clicks, spend, conversion, CPC, avg. pos., impressions) for the ranked keywords
- Impression share and the impression share lost due to rank for the ranked keywords.
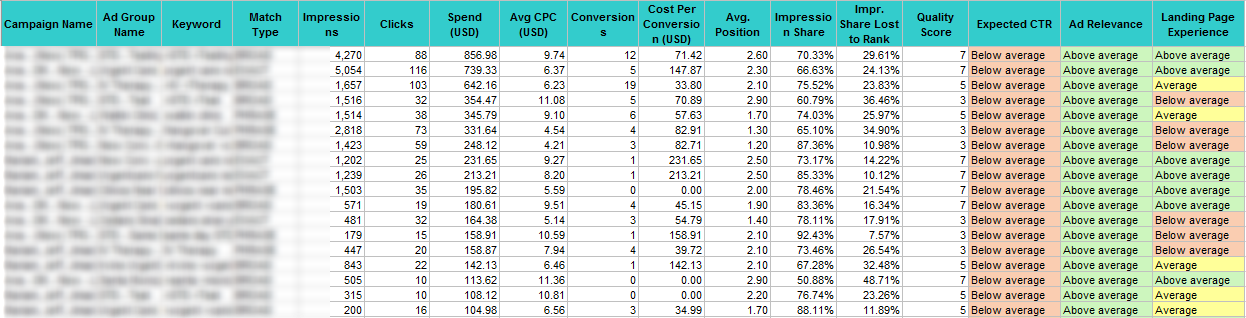
It also provides Keyword wise performance summary displaying the keywords, the campaign and ad group it belongs to, key metrics, quality score, ranking for each quality score component. You also get performance data basis Quality Score displaying the key metrics and keywords against each score.
There are visual charts that plot the following:
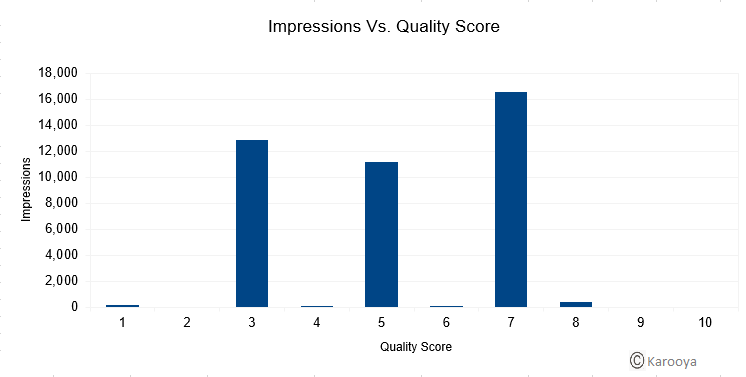
- Impressions vs. Quality Score
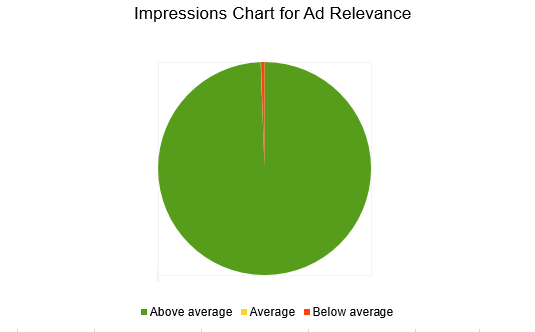
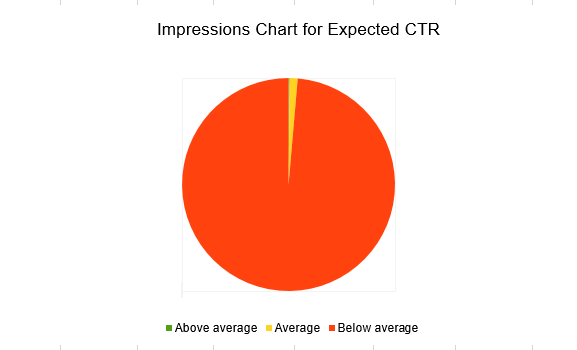
- Impression chart for all the key components of Quality Score
What should you look at?
The below average keywords data that are affecting your account’s performance. You can further drill down and figure out these keywords and drive your focus towards improving their performance
Reviewing the Report
Here are some of the graphical representation in the report:
1) Impressions vs. Quality Score
2) Impression Chart for Quality Score components
Here is how the data is consolidated in the report
1. Performance Summary for Quality Score components
2. Account Summary Keyword Performance Summary
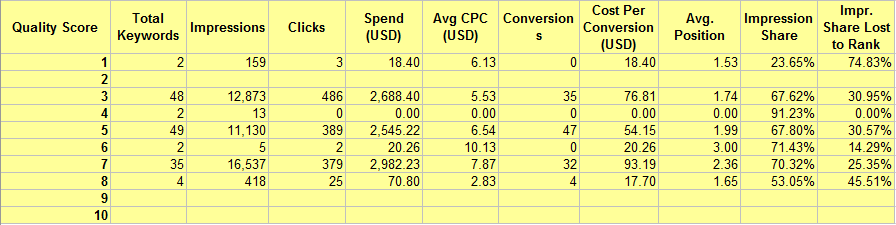
3. Quality Score Performance Summary
What is the next step?
The quick fix to improve quality score is to find out relevant keywords, concentrate on keywords with good QS and drive more value of it, drilling down the keywords that have a low Quality Score and determining if they are relevant for your campaign.
Related Articles:


Stop the wasted ad spend. Get more conversions from the same ad budget.
Our customers save over $16 Million per year on Google and Amazon Ads.