In the ever-evolving landscape of Google Ads, the Auction Insights report remains one of the most powerful yet underutilized tools for competitive intelligence. In 2025-2026, with the shift toward AI-driven campaigns like Performance Max and AI Max, understanding who is “eating your lunch” in the auction has become more complex—and more critical.
Every time a user searches on Google, a split-second auction determines which ads appear, in what order, and at what cost. Understanding how you stack up in these auctions isn’t just helpful—it’s essential for staying competitive in 2026’s increasingly crowded digital advertising landscape. That’s where Google Ads Auction Insights comes in. This built-in report shows you exactly who you’re competing against, how often they’re winning, and where your opportunities lie. Yet despite its power, many advertisers either ignore it completely or misinterpret what the data actually means.
TL;DR: What You Need to Know About Auction Insights in 2026?
- Auction Insights shows who you compete with in live Google Ads auctions.
- It does NOT show competitor bids, budgets, or creatives.
- The April 2025 double-serving update changed how Impression Share should be interpreted.
- Focus on trends over 30–90 days — not short timeframes.
- Use Overlap Rate + Position Above Rate together to identify real threats.
- Always pair Auction Insights with:
- Conversion data
- Impression Share Lost (Budget/Rank)
- Quality Score
- The goal isn’t to win every auction — it’s to win profitable ones
What Is Google Ads Auction Insights?
Google Ads Auction Insights is a competitive intelligence report that allows you to compare your ad performance against other advertisers bidding in the same auctions. Think of it as a window into your competitive landscape—showing not just how you’re performing, but how you measure up against everyone else fighting for the same search queries.
The report is available for Search campaigns, Shopping campaigns, and Performance Max campaigns (with some limitations we’ll discuss later). It’s based on actual auction data, which means you’re seeing real competitors, not theoretical ones.
Why Auction Insights Still Matters (Even in an AI‑Driven Google Ads World)
As Google Ads leans further into automation, advertisers often feel they have less visibility into what competitors are doing. Auction Insights remains one of the few first‑party reports that shows real competitive pressure inside live auctions, not modeled or third‑party estimates.
The digital advertising landscape has evolved dramatically:
- Rising Competition and Costs: Research indicates that businesses now generate approximately $2 in profit for every $1 spent on Google Ads in 2026, but average cost-per-click (CPC) rates continue climbing across industries. In some verticals like legal and finance, clicks can exceed $50 each.
- Increased Automation: With Google pushing Smart Bidding and automated campaign types like Performance Max, advertisers have less granular control over individual auctions. Auction Insights helps restore some visibility into what’s actually happening.
- The Double-Serving Policy Change: In April 2025, Google updated its Unfair Advantage Policy to allow advertisers to show multiple ads on the same SERP (provided they appear in different locations). This fundamentally changed how Auction Insights metrics should be interpreted—more on this critical update later.
- Performance Max Expansion: With Performance Max now offering Auction Insights segmented by Search and Shopping ads at the campaign and account level, advertisers finally have competitive visibility into these previously “black box” campaigns.
Limitations of Auction Insights (What The Auction Insight Doesn’t Tell You)
While powerful, Auction Insights has important limitations you should understand:
1. Overlapping Terms Only – You only see competitors who bid on the same keywords as you. If they’re succeeding with different keywords you haven’t considered, you won’t know.
2. Overlapping Auctions Only – Even on shared keywords, you only see data when you both appear in the same auctions. If your budget runs out and you stop showing ads, you lose visibility into what competitors do next.
3. No Bid Data – You can’t see what competitors are actually bidding. You can infer relative aggressiveness from the data, but you won’t know if they’re bidding $5 or $50.
4. No Creative Data – You don’t see competitor ad copy, extensions, or landing pages within Auction Insights. You need to research that separately.
5. No API Access (as of early 2026) – According to the Google Ads API team and confirmed through Google Groups community discussions, Auction Insights data is not available via API. This makes automation and custom reporting more difficult. However, a feature request has been submitted and is under review.
6. 10% Impression Share Minimum – If your activity falls below 10% Impression Share, you lose access to Auction Insights completely for that period, limiting visibility when you need it most.
How to Access Auction Insights?
Accessing the Auction Insights report is straightforward:
1. Sign in to your Google Ads account
2. Navigate to the level you want to analyze: Click on Campaigns, Ad groups, or Keywords in the left menu (depending on which report you want)
3. Select your target: Check the box next to specific campaigns, ad groups, or keywords
Note: You can only select keywords from a single page at a time (unless you run a report for “All”)
4. Click “Auction insights” in the page menu
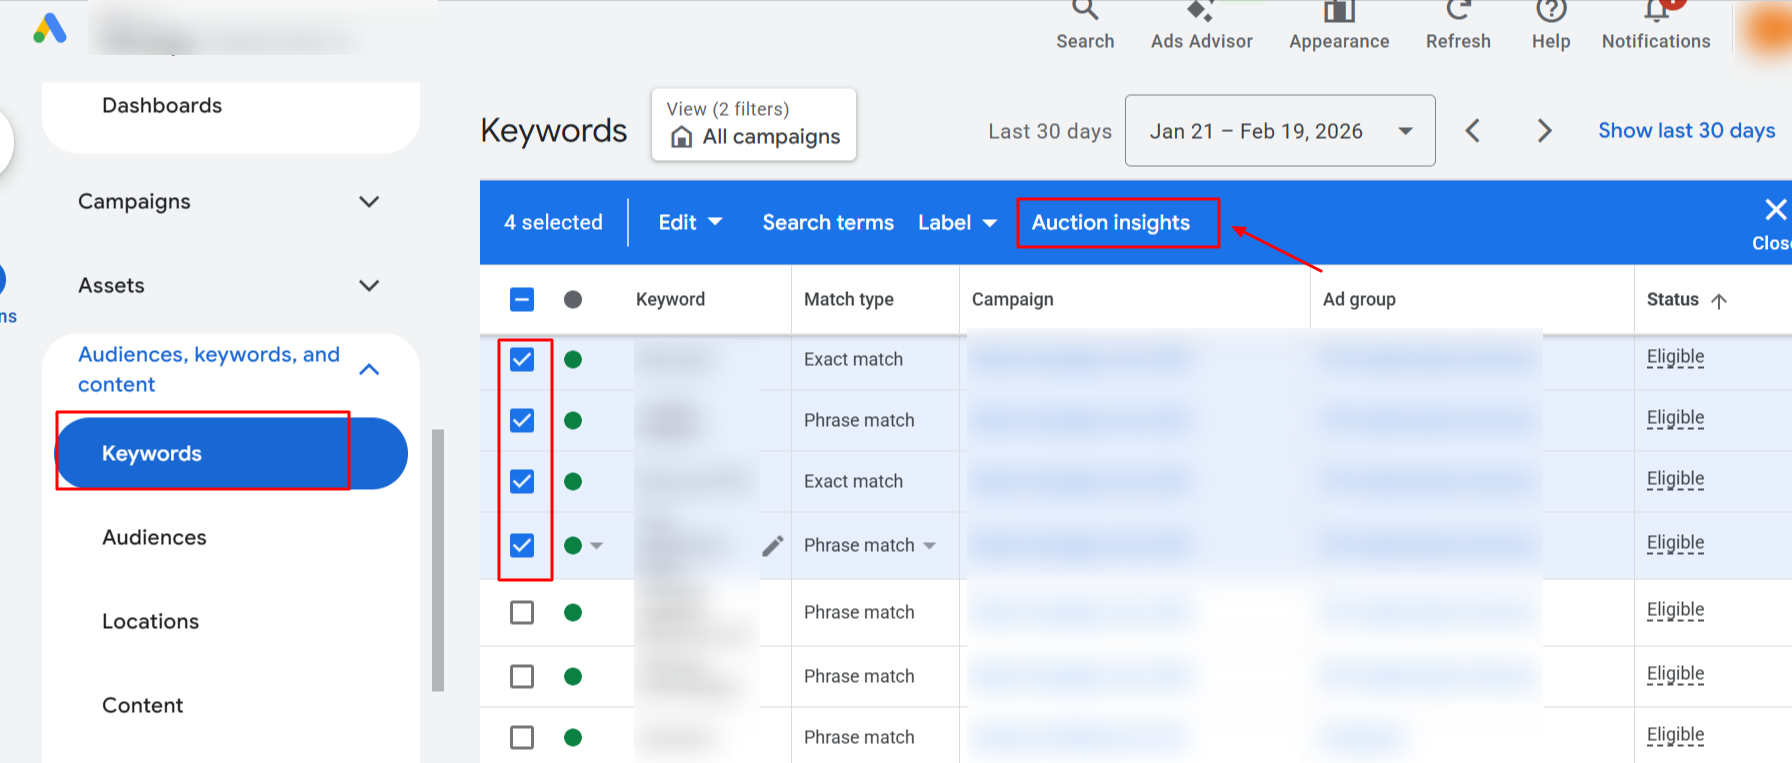
5. Set your date range: Choose your time period in the top right
6. View your competitive data
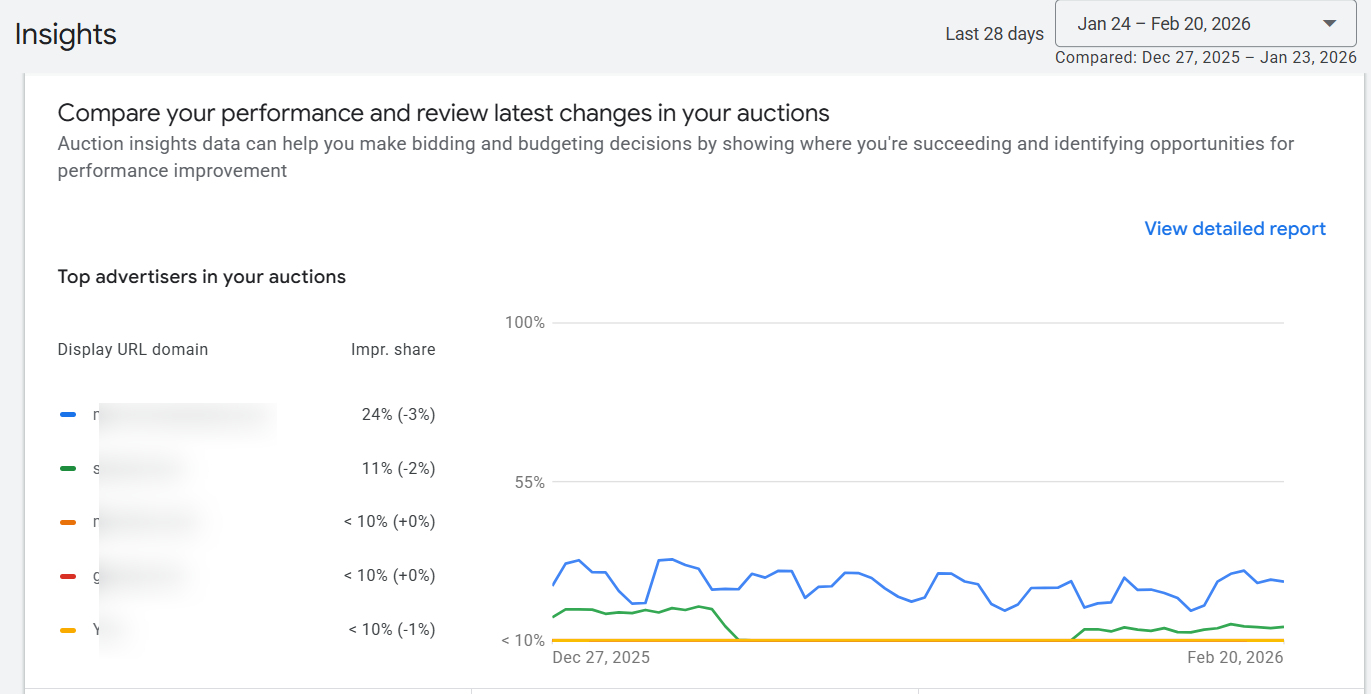
Pro Tip: The newer interface now lets you compare auction trends over two custom time periods — essential for seeing if competitor aggression changed post-optimization.
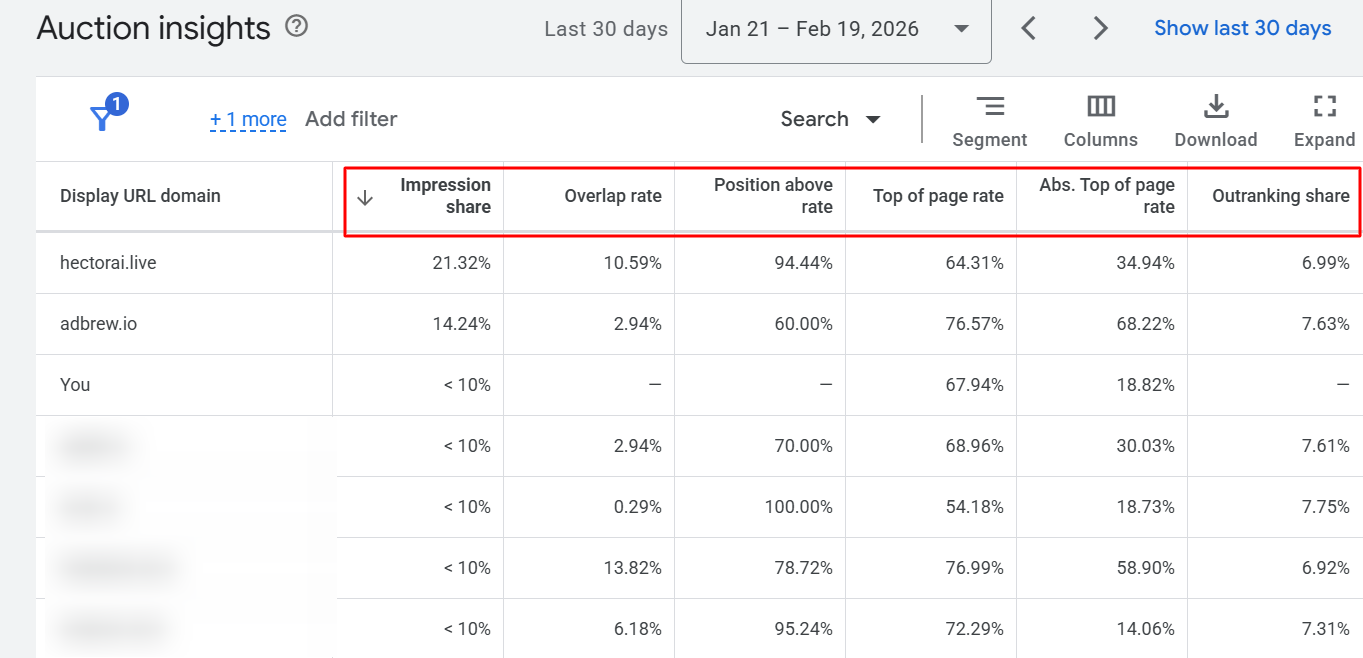
Key Metrics in the Auction Insights Table
1. Impression Share (IS)
What it is: The percentage of impressions your ads received out of the total number of impressions you were eligible to receive.
The formula: (Impressions you received / Eligible impressions) × 100
What it tells you: This metric shows your visibility in the auction. A low Impression Share means you’re missing opportunities—either because your budget ran out (Budget Lost IS) or because your bids weren’t competitive enough or your Quality Score wasn’t high enough (Rank Lost IS).
2026 Update – The Double-Serving Impact: Since Google’s April 2025 policy change allowing double-serving, Impression Share metrics have become more complex to interpret. When advertisers show multiple ads on the same SERP (top and bottom positions), each placement counts as a separate impression. This means:
- A competitor’s Impression Share may increase without them actually becoming more aggressive—they might just be double-serving more frequently
- Your own Impression Share might decline even if your strategy hasn’t changed, simply because eligible impressions have increased due to double-serving
Actionable insight: Compare your Impression Share to your main competitors. If theirs is significantly higher, investigate whether you’re losing to budget or rank. Add the “Impr. share lost (budget)” and “Impr. share lost (rank)” columns to your campaign view for clarity.
2. Overlap Rate
What it is: How often a competitor’s ad received an impression when your ad also received an impression.
What it tells you: This identifies your true paid search competitors—not necessarily your business competitors. A high Overlap Rate (60%+) means you’re frequently appearing in the same auctions, fighting for the same user attention.
Common misconception: Many advertisers assume high overlap is always bad. Actually, high overlap with low Position Above Rate (meaning they rarely rank above you) is a positive signal—you’re frequently beating a competitor who’s active in your space.
Actionable insight: Focus your competitive analysis on advertisers with high Overlap Rates. These are the domains you should research—look at their ad copy, landing pages, and offers using tools like the Google Ads Transparency Center.
3. Position Above Rate (Search Campaigns Only)
What it is: How often a competitor’s ad appeared in a higher position than yours when both ads were shown together.
What it tells you: This metric reveals which competitors consistently outrank you. Combined with Overlap Rate, it paints a clear picture of competitive dynamics.
Strategic interpretation:
- High Overlap + High Position Above Rate = Aggressive competitor consistently beating you
- High Overlap + Low Position Above Rate = Competitor you’re dominating despite frequent encounters
- Low Overlap + High Position Above Rate = Niche competitor who occasionally enters your auctions and wins when they do
Actionable insight: For competitors with high Position Above Rates, investigate their ad quality, extensions, and landing pages. They might not be outbidding you—they could have better Quality Scores.
4. Outranking Share
What it is: The percentage of times your ad ranked higher than a competitor’s ad, OR your ad showed when theirs didn’t.
Example: If you have a 70% Outranking Share against Competitor B, you “beat” them 70% of the time—either by ranking higher or by showing when they didn’t.
What it tells you: This is your overall competitive win rate against each competitor. It’s one of the most actionable metrics because it directly indicates your competitive advantage (or lack thereof).
Actionable insight: If your Outranking Share is declining against a key competitor over time, they’re becoming more aggressive. If it’s improving, your strategy adjustments are working. Track this monthly for your top 3-5 competitors.
5. Top of Page Rate
What it is: The percentage of times your ad (or a competitor’s ad) appeared above the organic search results.
Important distinction: “Top of page” doesn’t mean the #1 position—it means ANY ad position above organic results.
What it tells you: This shows how often you’re achieving visibility in the most valuable SERP real estate. Ads above organic results get significantly more clicks than ads below.
Actionable insight: If competitors have higher Top of Page Rates than you, consider increasing bids on high-value keywords or improving ad relevance and Quality Score to earn better positions more frequently.
6. Absolute Top of Page Rate
What it is: The percentage of times your ad appeared as the very first ad on the page.
What it tells you: This shows how often you’re capturing the single most prominent ad position. Position 1 typically has the highest click-through rate.
Competitive consideration: A competitor with a high Absolute Top of Page Rate is dominating the most visible position. This might justify aggressive bidding if those conversions are profitable, or it might indicate an area where you’re happy to let them overspend.
Actionable insight: Compare your Absolute Top Rate over time. If it’s declining, check if your Target Impression Share bidding (if you use it) is set appropriately, or if Quality Score issues are preventing you from competing effectively.
The 2025-2026 Game Changer: How Double-Serving Changed Everything
In April 2025, Google implemented a significant policy change that fundamentally altered how Auction Insights should be interpreted. Understanding this update is critical for anyone using the report in 2026.
What Changed?
Google updated its Unfair Advantage Policy to allow advertisers to display multiple text ads on a single search results page, provided they appear in different ad locations (top vs. bottom). Previously, the same advertiser was restricted to showing only one ad per SERP.
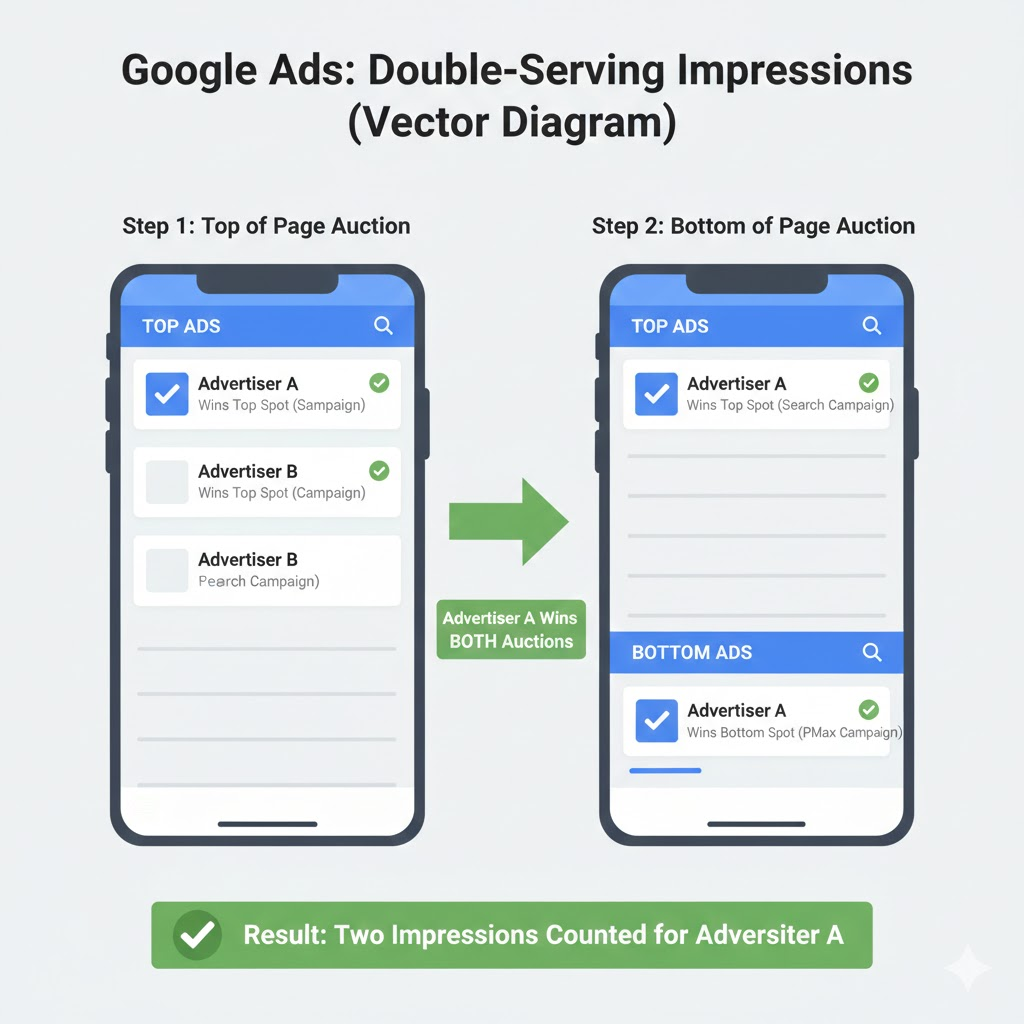
How it works now: Each ad location (top of page, bottom of page) has its own separate auction. An advertiser who wins the top auction can also compete in the bottom auction, potentially showing twice on the same page.
Common Auction Insights Mistakes (And How to Avoid Them)
Even experienced advertisers misuse Auction Insights. Here are the most common errors:
Mistake 1: Focusing Only on Impression Share
The problem: Impression Share without context is meaningless. A 30% Impression Share might be excellent if you’re dominating high-intent keywords, or terrible if you’re missing valuable traffic.
The fix: Always evaluate Impression Share alongside conversion metrics. Calculate your “Conversion Share” (your conversions ÷ total market conversions) if possible—that’s what actually matters.
Mistake 2: Trying to Compete Everywhere
The problem: Some advertisers see competitors with higher metrics and immediately increase bids across the board.
The fix: Be selective. Not every auction is worth winning. Focus your competitive spend on high-converting keywords and let competitors overpay for low-value traffic.
Mistake 3: Ignoring New Entrants
The problem: A new domain appears in your Auction Insights with just 5% Impression Share, so you ignore it. Three months later, they’re at 40% and eating your lunch.
The fix: Monitor ALL domains in your report, not just the leaders. Set up alerts when new competitors appear or when smaller competitors grow rapidly.
Mistake 4: Making Decisions Based on Short Time Frames
The problem: Looking at last week’s data and making major strategy changes based on temporary fluctuations.
The fix: Look at 30-day or 90-day windows for meaningful trends. Use shorter periods only to investigate specific events (competitor sales, seasonal spikes).
Mistake 5: Forgetting About Quality Score
The problem: Assuming that competitors with high Position Above Rates are simply outbidding you.
The fix: Check your Quality Scores. A competitor with QS 8/10 will outrank you even at lower bids than your QS 5/10 ads. Sometimes the answer isn’t bid more—it’s improve relevance.
Mistake 6: Not Checking Actual Competitor Ads
The problem: Making assumptions about why competitors are winning without seeing what they’re actually doing.
The fix: Manually search your top keywords (in incognito mode) and review competing ads. Use the Google Ads Transparency Center to see competitor creative. Look for:
- Stronger offers (free shipping, discounts)
- More compelling headlines
- Better use of extensions
- More specific or relevant messaging
Mistake 7: Misinterpreting Data Without Context
The problem: Taking metrics at face value without considering the bigger picture. Numbers without context can lead to panic, misguided strategy changes, and wasted budget.
One of the biggest mistakes is assuming that changes in Auction Insights always indicate competitive threats or strategy failures, when they might simply reflect natural fluctuations or data limitations.
Common context failures:
- Seasonality blindness: Your Impression Share drops from 60% to 35% in November, and you panic. But this might just be Q4 competition surge, not a permanent competitive threat. Similarly, your metrics might improve in January simply because competitors pull back budgets, not because your strategy improved.
- Budget exhaustion blind spots: When your daily budget runs out at 2 PM and your ads stop showing, you lose visibility into afternoon and evening auctions. Your Auction Insights only shows morning data, creating an incomplete picture. If a competitor ramps up spending in evening auctions, you won’t see it—because you weren’t there.
- Geographic aggregation: Your campaign targets 10 states with 50% overall Impression Share against Competitor A. The hidden truth? Competitor A might only be active in 3 states with 95% overlap there but 0% in others. The aggregated view masks intense regional battles.
- Match type confusion: Using broad match keywords means you’re appearing in a wider variety of auctions than exact match competitors. This explains why you might have lower Position Above Rates—you’re competing in more diverse (and less relevant) auctions.
- Quality Score invisibility: A competitor’s high Position Above Rate doesn’t always mean they’re outbidding you. They might have significantly better Quality Scores and actually pay LESS per click while ranking above you. Increasing bids in response creates an expensive bidding war when the real issue is ad relevance.
- Product mix mystery: If you sell budget and premium products in one campaign, aggregated Auction Insights makes competitors look more threatening across your entire business than they actually are. They might only compete on premium keywords where margins justify high bids.
- Campaign goal mismatch: A “bad” metric for one campaign type might be perfectly acceptable for another. A 70% Impression Share on branded keywords is a problem, but 30% on competitor conquest terms that delivers profitable conversions is a win.
- Time range sensitivity: Last 7 days is highly volatile and terrible for strategic planning. Last 90 days smooths fluctuations and shows trends. The date range you select fundamentally changes what the data means.
The fix: Before reacting to any Auction Insights data:
- Cross-reference with business metrics—are conversions and ROI declining, stable, or improving?
- Investigate the why—don’t just notice changes, figure out the root cause
- Consider your constraints—your budget, Quality Score, and profitability goals limit your optimal metrics
- Think long-term—competitive intelligence is a marathon, not a sprint
- Always ask “what does this metric mean in MY specific situation?” before making changes
- Compare year-over-year for the same period, not just month-over-month
- Check your “Impression Share Lost (Budget)” metric—if above 20%, your view is incomplete
- Segment campaigns by product category, geography, or device for more accurate insights
Context transforms Auction Insights from confusing numbers into actionable intelligence.
FAQ: Quick Answers to Common Auction Insights Questions
Q: How often should I check Auction Insights? A: For stable accounts, monthly reviews are sufficient. During high-competition periods (holidays, product launches, competitor sale periods), check weekly. Set up alerts for significant changes (>15% shift in key metrics).
Q: Can I use Auction Insights for Display or Video campaigns? A: No. Auction Insights is only available for Search, Shopping, and Performance Max campaigns (with Search/Shopping insights).
Q: What should I do if my Impression Share is low? A: First, determine WHY. Check your “Impression Share Lost (Budget)” and “Impression Share Lost (Rank)” columns. If budget-limited, increase daily budget. If rank-limited, improve Quality Score or raise bids.
Q: How do I beat a competitor who consistently outranks me? A: Five approaches:
- Improve Quality Score through better ad relevance and landing page experience
- Increase bids strategically on high-converting keywords
- Use better ad extensions to increase ad rank without raising bids
- Target keyword variations where they’re less active
- Differentiate your offer so click-through rate improves even at lower positions
Q: Do Auction Insights include data from Google Search Partners? A: Data from Search Partners is included in the report, but partners don’t distinguish between “top” vs. “other” positions, so those specific metrics aren’t segmented.
Q: Can competitors see my data in Auction Insights? A: Yes, your domain appears in competitor’s Auction Insights reports just as theirs appears in yours. However, they only see the same metrics you see—not your bids, budgets, or proprietary strategy details.
Q: Why would I want a LOW Overlap Rate with competitors? A: Low overlap often indicates you’ve found less competitive keyword territory—meaning more opportunity to win auctions at lower costs. It can also indicate you’re targeting very different audiences than competitors, which might be strategic or might reveal missed opportunities.
Q: Should I always try to maximize Absolute Top of Page Rate? A: Not necessarily. Position 1 is expensive and doesn’t always convert proportionally better than positions 2-3. Calculate your cost-per-conversion by position to see if the premium you pay for #1 is worth it for your business.
Conclusion: Making Auction Insights Your Competitive Advantage
Google Ads Auction Insights isn’t just another report—it’s your window into the competitive battlefield. In 2026’s increasingly crowded and expensive digital advertising landscape, understanding who you’re fighting, how often you’re winning, and where your opportunities lie isn’t optional—it’s essential.
The advertisers who win aren’t necessarily those with the biggest budgets. They’re the ones who:
- Regularly monitor Auction Insights (monthly minimum, weekly during high-competition periods)
- Understand what metrics actually mean (especially post-double-serving)
- Take strategic action based on competitive dynamics, not just gut feelings
- Combine Auction Insights with other data (conversions, Quality Score, search terms)
- Focus on winning the right auctions, not all auctions
Start with these immediate action steps:
This week:
- Run Auction Insights reports for your top 3 campaigns
- Identify your top 5 competitors by Overlap Rate
- Research those competitors’ ads and landing pages
This month:
- Set up a monthly Auction Insights tracking spreadsheet
- Analyze trends in Impression Share and Position Above Rate
- Identify 1-2 strategic changes based on competitive gaps
Remember: the goal isn’t to obsess over competitors. It’s to make smarter decisions about where to invest your budget, how to differentiate your messaging, and when to fight versus when to find less competitive opportunities.


Stop the wasted ad spend. Get more conversions from the same ad budget.
Our customers save over $16 Million per year on Google and Amazon Ads.