Elevate your digital ad strategy with Tinuiti’s Q1 report—a deep dive into performance across Google, Meta, Amazon, and more. Packed with insights from anonymised campaign data, this report delivers the intelligence you need to stay ahead and make smarter, data-backed decisions.
The complete report can be downloaded here.
Digital Ad Spend Holds Steady in Q1; Eyes Turn to US Tariff Risks
Amid growing focus on generative AI search, Google’s paid search click growth accelerated from 3% in Q4 to 4% in Q1
Amazon Sponsored Products spend growth accelerated to 11%, supported by a second consecutive quarter of double-digit click growth. Meanwhile, click volume for Google Shopping ads—including Performance Max campaigns—rose 9% year-over-year in Q1, up from just 1% growth in Q4.
Median same-store growth among TikTok advertisers swung from a 13% increase in Q4 to an 11% decline in Q1. Meanwhile, in the first quarter, the number of active advertisers on Reddit and Snapchat climbed 66% and 33% year over year.
Search Ad Spending Grows on Higher CPCs Despite Modest Click Gains
CPC growth was especially strong for branded text search ads, while shopping ad CPCs dipped slightly in Q1
Google search ad spend rose 9% YoY in Q1 2025, down slightly from 10% in Q4. Click growth edged up to 4%, but higher CPCs, up 5%, remained the main driver. Branded text ad CPCs surged, while shopping ad CPCs dipped slightly.
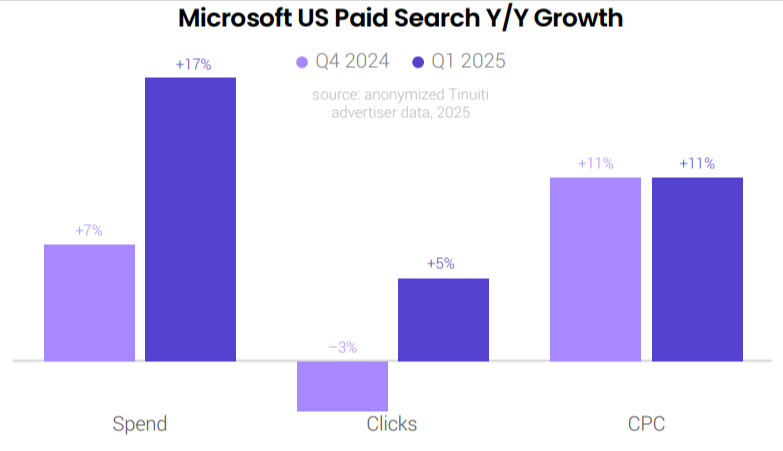
Microsoft’s search ad spending rose 17% year over year in Q1 2025 for Tinuiti clients, accelerating from 7% growth in Q4 2024. Click volume across text, shopping, and Performance Max formats increased 5% year over year in Q1, rebounding from a 3% decline in the previous quarter. As with Google, most of Microsoft’s search ad growth in Q1 was driven by higher click costs, with average CPC rising 11% year over year, unchanged from Q4.
In Q1, advertisers experienced improved click growth on Google Shopping formats, with clicks rising 9% year over year, up from just a 1% increase in the previous quarter. Meanwhile, the average cost per click (CPC) for Google Shopping ads declined 1% year over year, reversing a 9% increase seen in Q4.
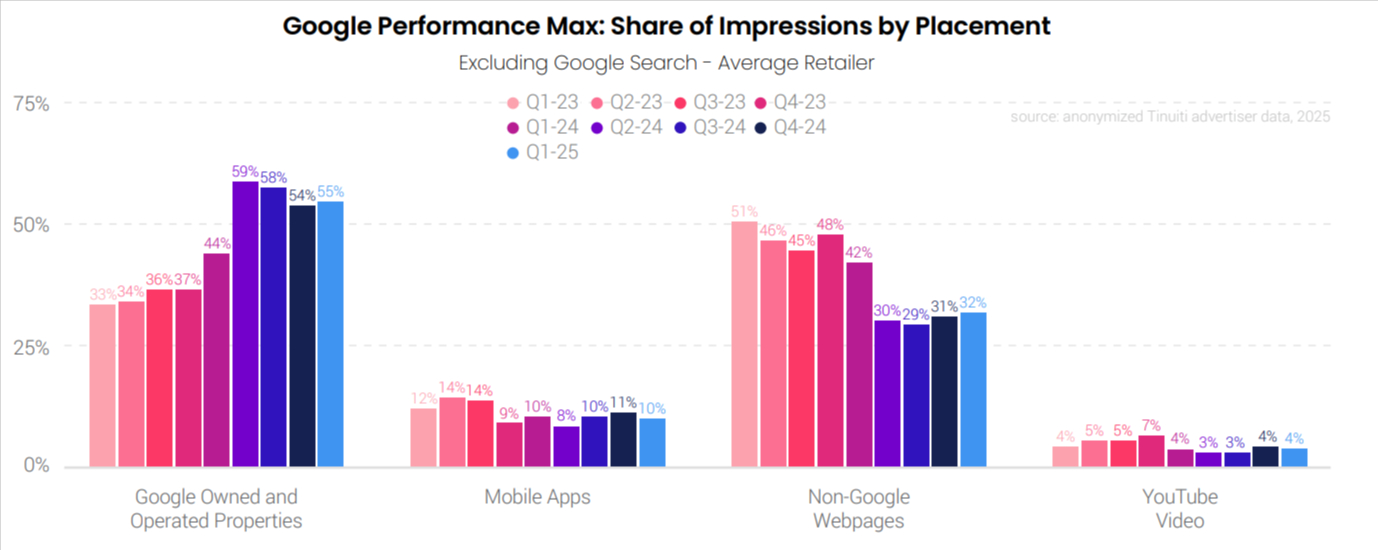
In Q1 2025, 55% of PMax impressions came from Google-owned properties (excluding Search and YouTube), up from 44% a year earlier. Account-level exclusions introduced in March 2024 reduced non-Google impression share to 32%, down from 42%. YouTube video accounted for 4% of impressions.
Between branded and non-branded text ads, Brand text ad CPCs rose 19% year over year in Q1 for the median advertiser compared to just 3% for non-brand keywords.
In Q1 2025, PMax campaigns drove 5% higher sales per click than Shopping, despite 10% lower conversion rates and 13% higher CPCs, resulting in a 7% lower ROAS, a decline that has widened year over year.
Social Surge: Ad Spend Accelerates on Leading Platforms
Meta ad spend rose 11% in Q1 2025 as CPMs edged up, with Advantage+ Shopping making up 38% of spend. Pinterest ad spend jumped over 30%, also driven by higher CPMs.
As Meta advertisers saw CPM rising by 4% Y/Y, they even saw bigger increases, with CPM up by double digits for more than 50% of the advertisers studied for this report. Advantage+ Shopping Campaigns captured 38% of retail Meta ad spend in Q1 2025, marking a significant jump from 24% in Q1 2024.
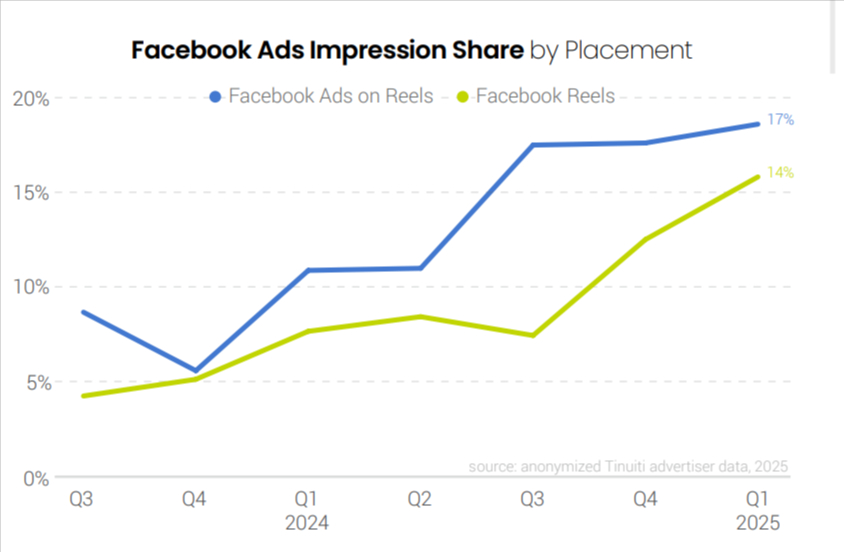
Facebook Reels ad impressions saw significant growth, with video ads doubling their share from 7% in Q1 2024 to 14% in Q1 2025. When combined with other Reels ad formats, they accounted for 17% of impressions. Overall, Reels now constitute 31% of Facebook’s total ad impressions, up from 27% in Q4 2024 and 17% in Q1 2024.
Pinterest advertisers who are active since at least Q1 2024 boosted their year-over-year ad spend by 32%, accompanied by a 2% lift in impressions and a 29% rise in CPM. This marks the second consecutive quarter of CPM growth exceeding 20%. Pinterest advertisers are increasingly utilising the Performance+ suite, including AI-powered tools such as Performance+ ROAS bidding and creative, with early adopters seeing positive results.
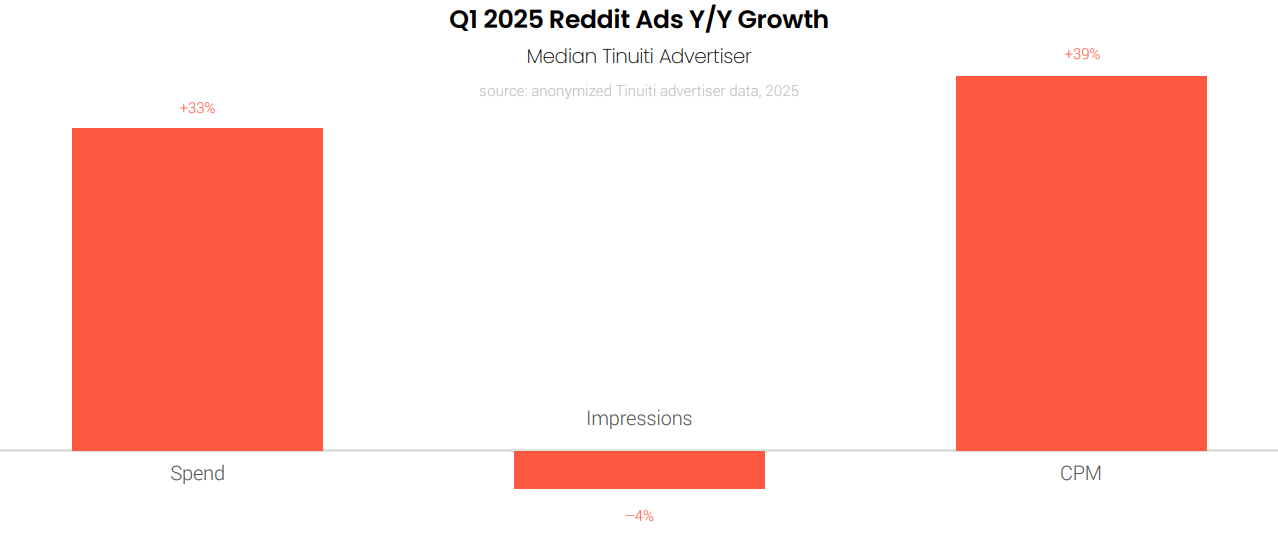
Advertising spend on Reddit rose 33% year over year for the median advertiser active on the platform since at least Q1 2024, with a 4% decline in impressions and a 39% increase in CPM.
Tinuiti clients saw a significant rise in Reddit ad usage, with active advertisers increasing by 66% between Q1 2024 and Q1 2025, complementing strong same-store growth.
In Q1 2025, advertisers active on both Pinterest and Meta allocated 24% of their spend to Pinterest, compared to Meta. For TikTok, the figure stands at 23%, while Snapchat sees 15%, and Reddit only 7%. It’s important to note that the number of advertisers on these platforms is significantly lower than on Meta, with variations across each platform.
CPC Surge Fuels Amazon and Walmart’s Growing Ad Spend in 2025
Amazon: Slight 1% CPC rise for Sponsored Products, significant 28% for Brands YoY. Walmart Q1: Sponsored Videos CPC dips below Sponsored Products.
Walmart Sponsored Products ad spend rose 14% in Q1, a slowdown from the 53% surge seen in Q4. Click volume remained flat year-over-year at 1%, while CPC increased 13%. Recent CPC increases have generally aligned with corresponding gains in sales per click. Despite recent gains, Q1 2025 CPCs remain below Q1 2022 levels.
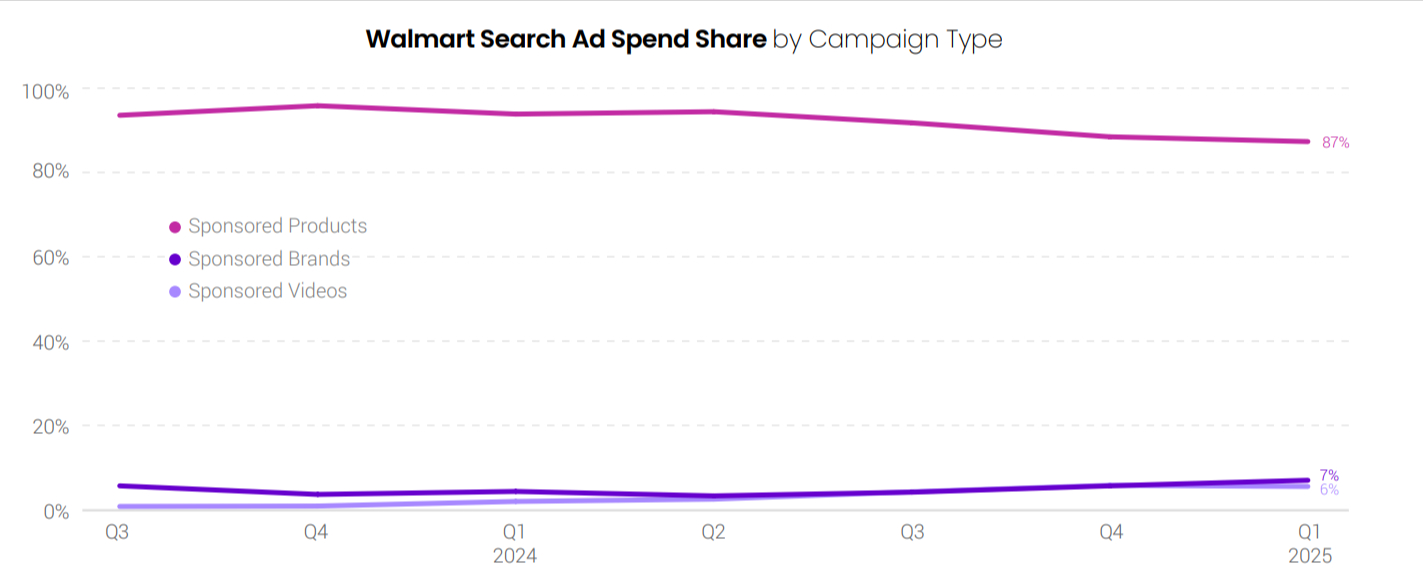
Walmart advertisers spent 7% of their search advertising investment on Sponsored Brands and 6% on Sponsored Videos in Q1 2025. Just like Amazon, Sponsored Products remain the dominant search ad format on Walmart, representing 87% of search ad spend in the first quarter.
In Q1, Sponsored Videos had a CPC 26% higher than Sponsored Products for the median advertiser using both formats—a decrease from the 35% premium seen in Q4.
Walmart’s display advertising tools allow advertisers to target inventory both on Walmart’s website and app as well as off-site. In Q1 2025, 52% of Walmart’s display ad spend was directed toward onsite inventory, down from 68% in Q4. Meanwhile, off-site inventory grew from 32% to 48% of total display spend over the same period.
Strong Growth in YouTube Ad Impressions Offset by Falling CPMs
YouTube impression growth slowed to 21% in Q1 from 28% in Q4, while CPM declines eased to 13% from 16%. Google Demand Gen spend rose 7% year over year.
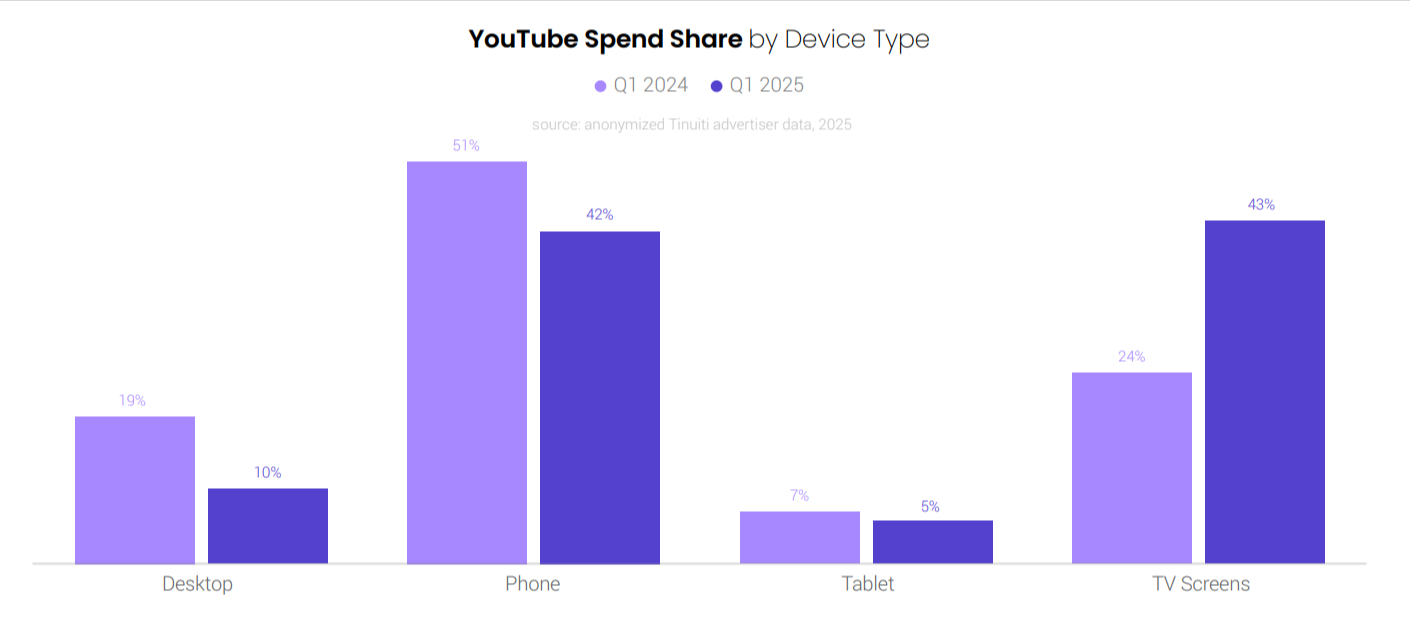
In February 2025, YouTube announced that TV had become the dominant viewing platform across its services by the end of 2024. In Q1 2025, TV screens accounted for 43% of advertiser spend on YouTube video ad campaigns, narrowly surpassing mobile phones at 42%. Desktop and tablet devices contributed 10% and 5% of spend, respectively. Year over year, ad spend on YouTube via TV screens surged 88% in the first quarter.
In April 2025, Google discontinued the creation of new Video Action Campaigns and began recommending Demand Gen campaigns as the preferred alternative. Since then, more advertisers have been exploring Demand Gen’s video ad formats and inventory, pushing video’s share of Demand Gen spend to a record-high 42% in March 2025.
Brand spend on Google Display Network (GDN) ads grew 9% year over year in Q1 2025, despite a 1% decline in impressions. The average CPM increased by 10% over the same period.
Once again, click here to download the complete report.
Related Links


Stop the wasted ad spend. Get more conversions from the same ad budget.
Our customers save over $16 Million per year on Google and Amazon Ads.