Tinuiti, a US-based digital marketing agency, presents the Q2 2023 Digital Ads Benchmark Report, offering valuable insights into the latest trends for Google, Meta, Amazon, and various other platforms. This report draws from anonymized performance data collected from Tinuiti’s managed advertising programs and showcases several noteworthy findings, as outlined below.
The complete report can be downloaded here.
Meta and Instagram ad spend grew the most as impressions exploded
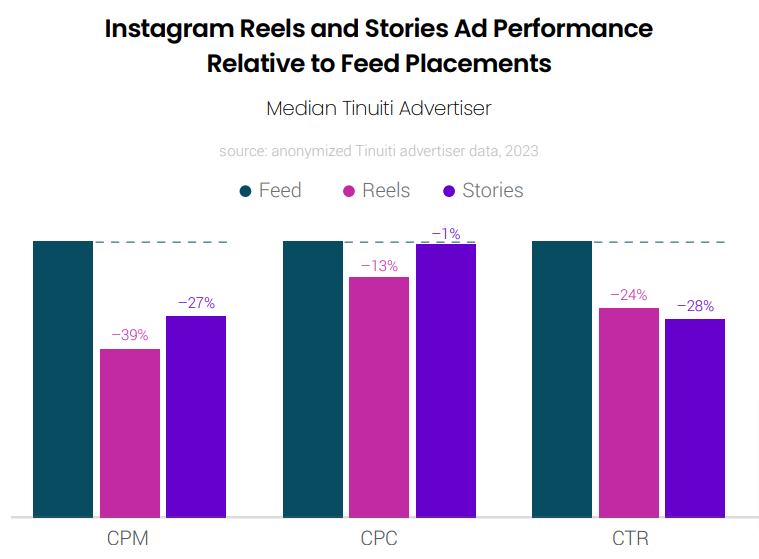
In Q2 2023, advertiser investment in Meta properties increased by 9% compared to the previous year. Impressions also showed significant growth, rising by 44% for Meta and 84% for Instagram year over year. However, there was a decline in CPM, with Instagram experiencing a 29% decrease and Meta with a 24% decrease. In contrast, Facebook’s CPM rose by 37%, while its impression growth remained robust at 37% in the second quarter.
The CPC for Instagram Reels ads showed a narrower gap compared to Instagram Feed ads, with a 13% reduction, which is less than the 19% difference observed in Q1 2023. On the other hand, TikTok advertisers experienced a rebound in impression growth, going from a 13% decline in Q1 to a 16% increase in Q2. Although spend growth slowed down from Q1, it still remained strong at 11%.
TikTok CPM dipped 5% in both May and June 2023. CPM and similar metrics are influenced not just by ad demand but also by the gradual introduction and acceptance of newer ad formats and placements over time.
CPCs for Google & Retail Google search grew over pre pandemic level
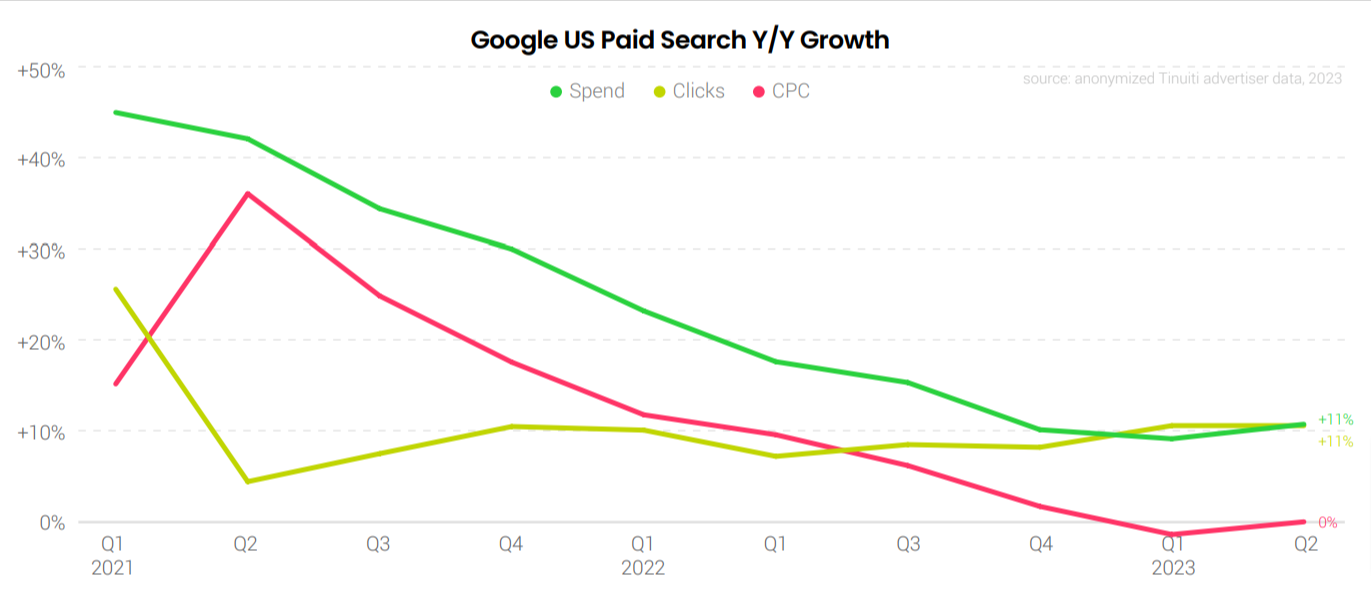
In Q2 2023, spending on US Google search ads showed a Y/Y growth of 11%, up from 9% in the previous quarter, marking the first acceleration in growth since early 2021. Click growth remained steady at 11% Y/Y, while the average cost per click remained flat during Q2, in contrast to a 1% decline observed in Q1.
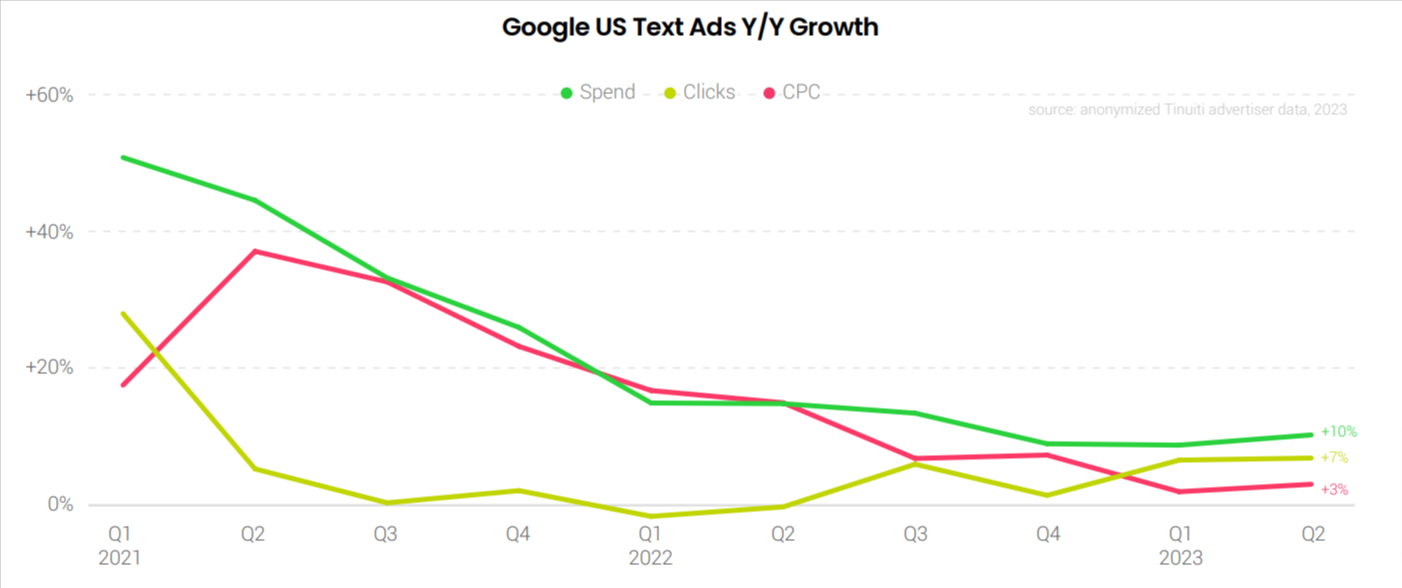
Retail Google search CPCs were up by an average of 25% over 2019 levels in Q2 2023, compared to a 20% gain in Q1. Expenditure on Google text search ads increased by 10% in Q2 2023 compared to 9% in the previous quarter. The growth in text ad clicks remained steady at 7% year over year, while the CPC growth escalated from 2% in Q1 to 3% in Q2.
Starting in May, Google ceased creating Similar segments for new first-party audience segments. However, the Similar audience segment continued to play a substantial role in driving traffic in Q2 2023, representing 12% of the total Google search ad clicks.
Expenditure on Google Shopping ads, including Performance Max campaigns, increased by 11% year over year, compared to 10% in Q1. Although Shopping click growth slightly decelerated to 13% year over year, CPC growth showed improvement with a decline of 2% year over year, nearly two points higher than the previous quarter.
Amazon & Walmart Sponsored Products – Mixed spend growth trends
Advertisers increased Sponsored Product spend by 8% year over year in Q2, with sales attributed to the format also growing 8% however, Walmart sponsored product spend growth was doubled from 19% in Q1 to 39% in Q2.
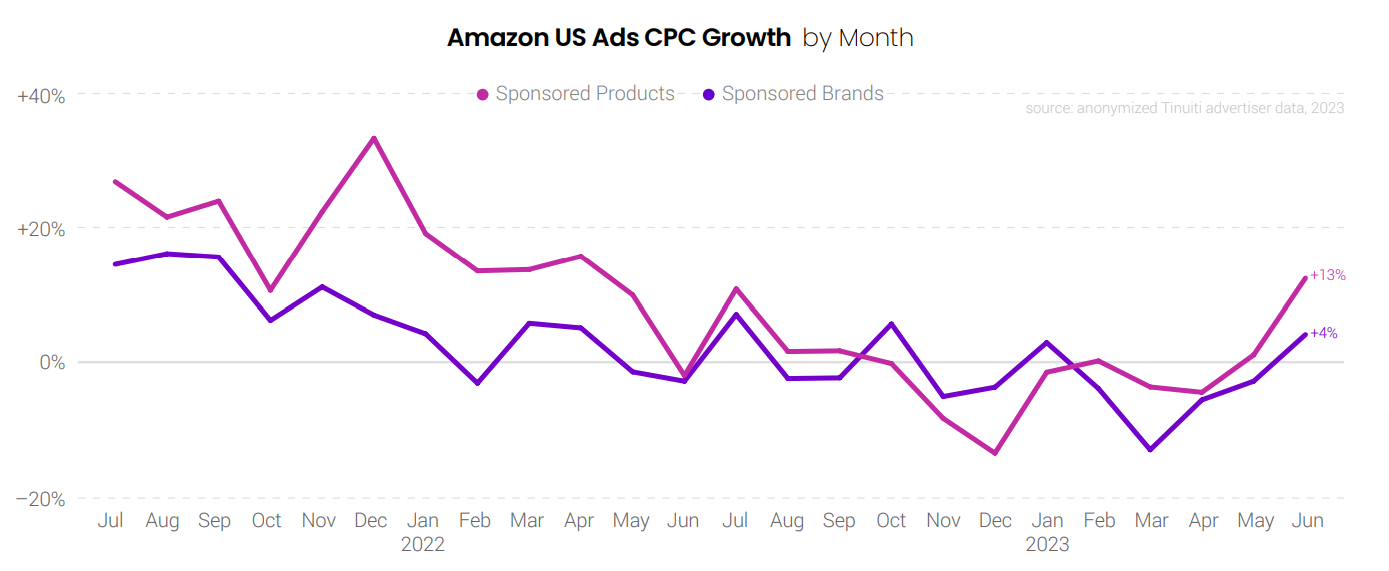
CPC growth for Amazon Sponsored Products and Brands grew from 4% in April to 13% in June. while Sponsored Brands CPC rebounded from a 5% year-over-year decline in April to a 4% growth in June.
On the flip side, Amazon-sponsored display spend growth fell from 92% in Q1 2022 to 59% in Q2 2022. The smallest decline of 10% in CPC in Q2. With regards to CPC growth for Amazon-sponsored products, ten out of the thirteen product categories saw positive growth.
The average CPC for Walmart Sponsored Products was 41% higher in June 2023. This shows that 93% of all Walmart search spend went to Sponsored Products in Q2 2023, with the remaining 7% attributed to Sponsored Brands.
Spending among YouTube advertisers experienced an increase
Among YouTube advertisers who were active in both Q2 2022 and Q2 2023, spending on the platform showed a year-over-year increase of 9% in the second quarter, compared to 8% in Q1. YouTube ad impression growth continued to be robust, rising by 34% year over year, while the average CPM experienced an 18% year-over-year decline.
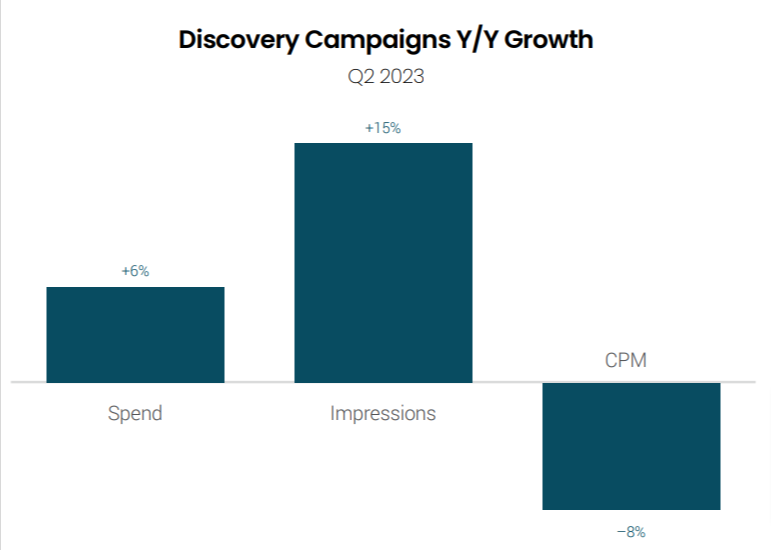
Among the brands that utilized Discovery campaigns in both Q1 and Q2 2023, spending increased by 6% in Q2 compared to the previous year. Discovery impression growth also showed improvement, rising from 12% year over year in Q1 to 15% in Q2. However, CPMs witnessed a decline of 8% in Q2 2023, contrasting with a 2% increase observed in Q1 2023.
48% of Amazon DSP spend was attributed to Amazon-owned-and-operated (O&O) properties in Q2 2023. The share of impressions coming from Amazon properties typically goes up during Prime Day as shoppers flock to Amazon’s site and app.
Once again, to get the complete Digital Ads Benchmark Report, download the report
Related Links


Devesh
Great insights in the Digital Ads Benchmark Report! The growth trends for Meta and Instagram are particularly noteworthy. It’s exciting to see how digital marketing continues to evolve. Thanks for sharing this valuable information!