Boost your digital advertising game with Tinuiti’s Q2 report—a detailed look at how major platforms like Google, Meta, and Amazon performed. Using anonymized campaign data, it offers valuable insights to help you stay ahead of the curve and make smarter, data-driven decisions.
The complete report can be downloaded here.
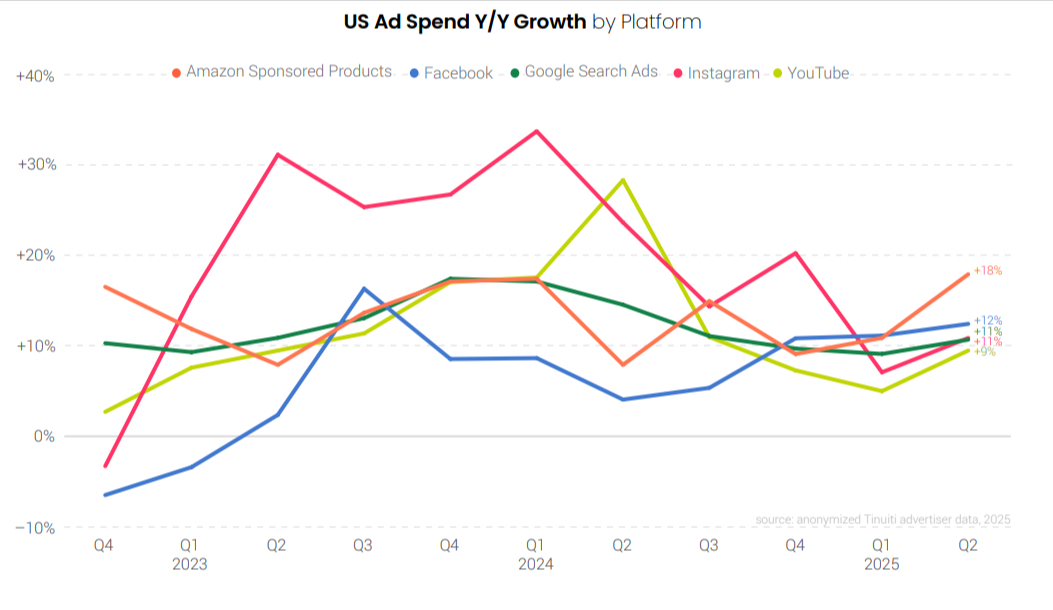
Ad Investments Surge Across Major Platforms in Q2
Ad spend increased more rapidly in Q2 across Google Search, Meta, Amazon Sponsored Products, and YouTube. To manage rising costs, many brands chose to renegotiate contracts or shift production, helping them protect profits while keeping ad budgets steady.
One reason ad spend stayed strong is that steep tariffs were rolled back — the 145% rate on Chinese goods dropped to 30% in May. This had a big impact on China-based brands like Shein and Temu. Both paused their Google Shopping ads around mid-April. Shein resumed ads a little over a month later after the tariff cut, and Temu slowly started showing up again in Google Shopping reports by late June.
Advertisers are still increasing their investment in YouTube video campaigns, but many are also using Demand Gen campaigns to access Google’s video inventory. In June, around half of Demand Gen’s spending went to video. Overall, Demand Gen spending grew 23% year over year in Q2, boosted by Google’s April move to stop new Video Action Campaigns.
Ad prices slowed in Q2 for query-based formats like Amazon Sponsored Products and Google paid search. However, clicks on Amazon Sponsored Products jumped 19%—the biggest rise since Q4 2022—while Google paid search also saw its highest click growth.
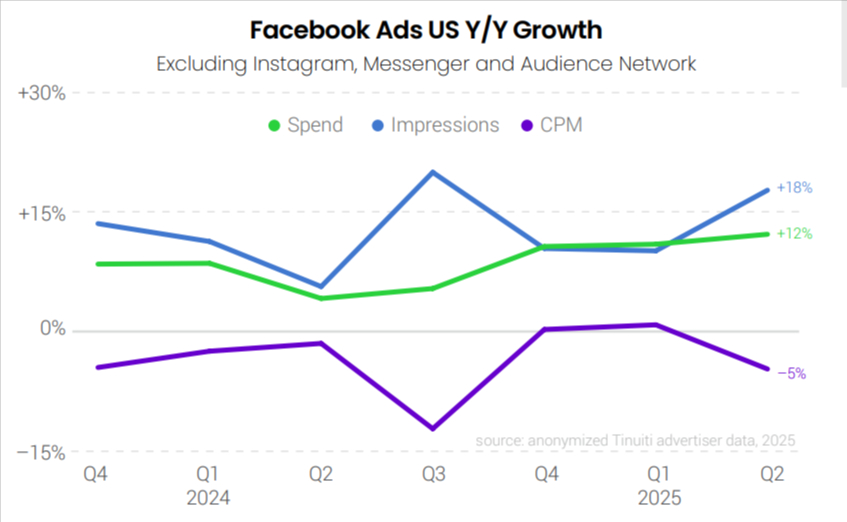
Paid Social – Meta Trio Sees Ad Spend Surge
Ad spend on Meta platforms, including Facebook and Instagram, grew 12% year-over-year in Q2 2025. Facebook saw a 12% increase in spend, up from 11% in Q1, while Instagram ad spend rose 11% despite a 1% drop in impressions. Overall impressions on Meta rose 13%, and average CPM increased 12%—marking the fifth consecutive quarter of double-digit growth, though at the slowest pace since Q1 2024.
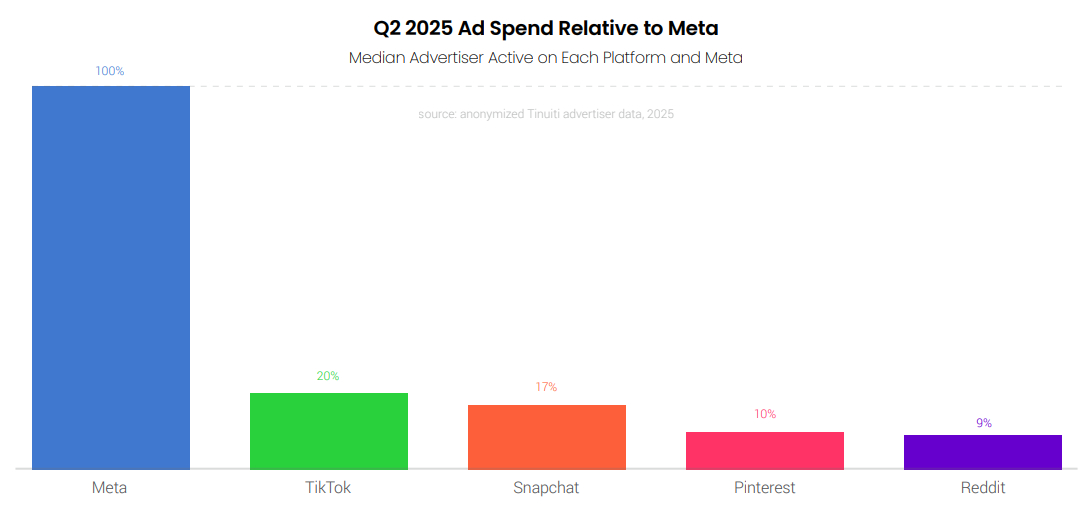
In Q2 2025, advertisers who used both Reddit and Meta spent about 9% of their Meta budget on Reddit. Pinterest and Snapchat saw 10% and 17% of Meta’s spend, respectively. Although many brands cut back on TikTok spending compared to last year, the typical advertiser still spent 20% as much on TikTok as on Meta, showing that TikTok remains a key part of social media budgets.
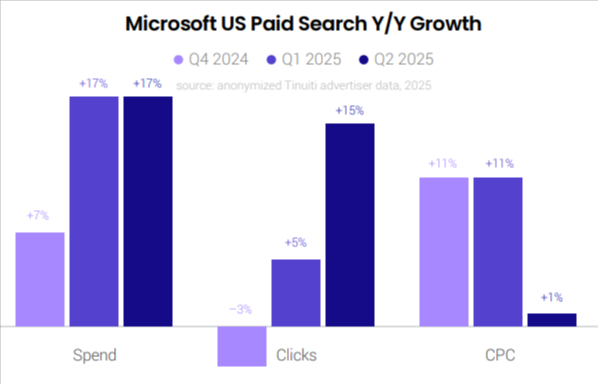
Paid Search – CPC Growth Cools on Major Search Platforms
Spending on Google paid search ads was up 11% year over year in Q2 2025. Click growth accelerated to 7% year-over-year, while CPC growth slowed to 3%. Spending on Microsoft search ads was up 17% year over year in Q2 2025.
Microsoft’s version of Performance Max campaigns saw a 15% year-over-year increase in Microsoft paid search clicks. CPC growth, however, decelerated sharply from 11% in Q1 2025 to just 1% in Q2.
Advertiser spending on Google Shopping (including both standard Shopping and Performance Max) grew by 19% in Q2, up from 8% in Q1. Tinuiti advertisers saw an 18% increase in Shopping ad clicks, double the growth from the previous quarter, while average CPC rose only 1%.
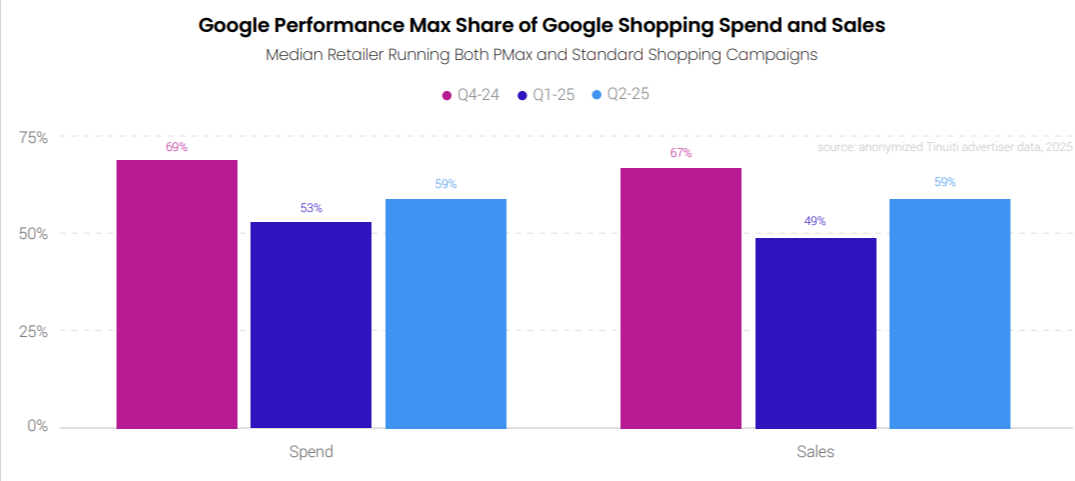
After a dip from Q4 2024 to Q1 2025, spending on Google Shopping ads through Performance Max (PMax) rose again in Q2. For advertisers using both PMax and standard Shopping, PMax made up 59% of ad spend in Q2, up from 53% in Q1. It also drove 59% of the revenue from Google Shopping listings.
In Q2 2025, 55% of Performance Max impressions outside Google Search appeared on other Google-owned platforms (excluding YouTube). Mobile apps made up 11% of impressions, and YouTube videos accounted for 5%.
The CPC for Google search ads on a brand’s own name has been climbing faster than for non-brand ads.
- In early 2025 (Q1), the cost of brand-name ads jumped by 19%, while other ads only saw a 3% increase.
- The trend continued in the second quarter (Q2), but the difference was smaller. Brand ad costs went up by 13%, while non-brand ads again rose by 3%.
Walmart & Amazon See Higher CPCs for Sponsored Brands
Amazon and Walmart’s Sponsored Brands Outperform Sponsored Products. In the second quarter of 2025:-
- Amazon Sponsored Products ad spending grew by 18%, with clicks increasing by 19%. The CPC for these ads remained mostly flat, only dropping by 1%.
- Amazon Sponsored Brands saw an 18% rise in CPC, but clicks on these ads fell by 20%.
- Walmart Sponsored Products clicks surged by 26%, the first time click growth outpaced CPC growth since mid-2023.
- Walmart Sponsored Videos ads are still more expensive than Sponsored Products, but the price gap is shrinking. The CPC for video ads was only 16% higher in Q2, down from a 35% difference at the end of last year.
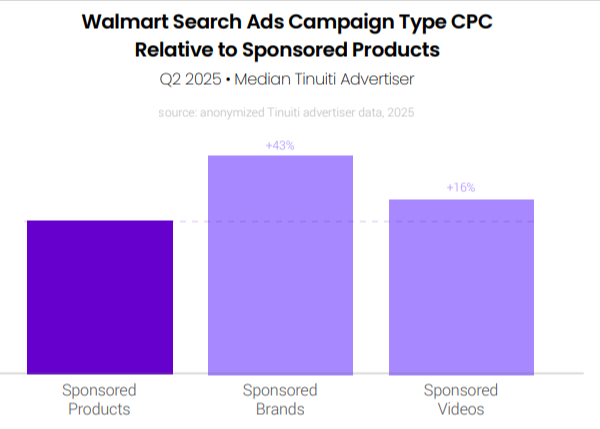
Advertisers are increasingly using Walmart Sponsored Videos and Sponsored Brands. Still, 85% of Walmart search ad spend goes to Sponsored Products. Sponsored Videos, launched broadly in late 2023, now make up 8% of the spend, while Sponsored Brands account for the remaining 7%.
Video Ads Take the Lead: YouTube Spend Up, Demand Gen Follows
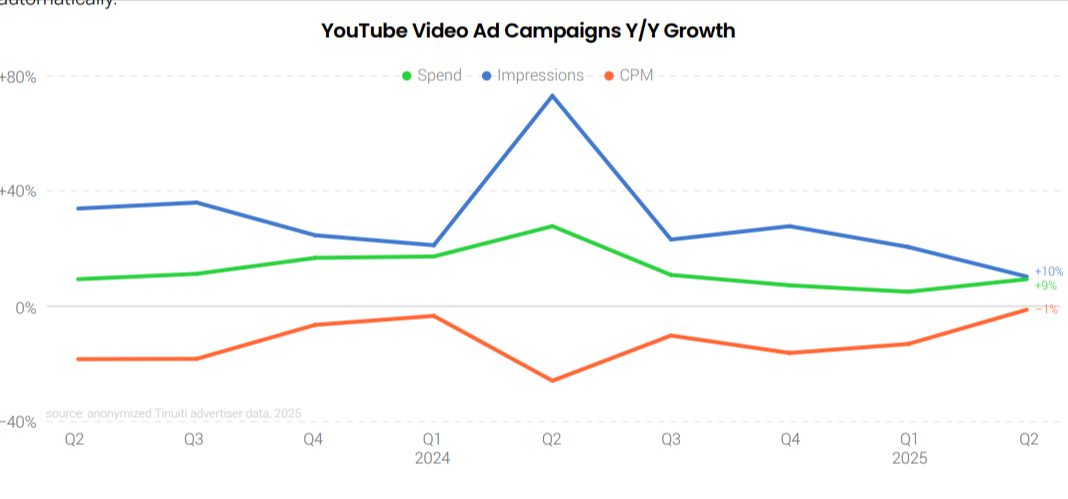
YouTube video ad spend grew 9% year-over-year in Q2 2025, with impressions up 10% and average CPM down 1%. While video campaigns remain the main way to buy YouTube ads, more impressions are now coming from other Google campaign types like Performance Max and especially Demand Gen.
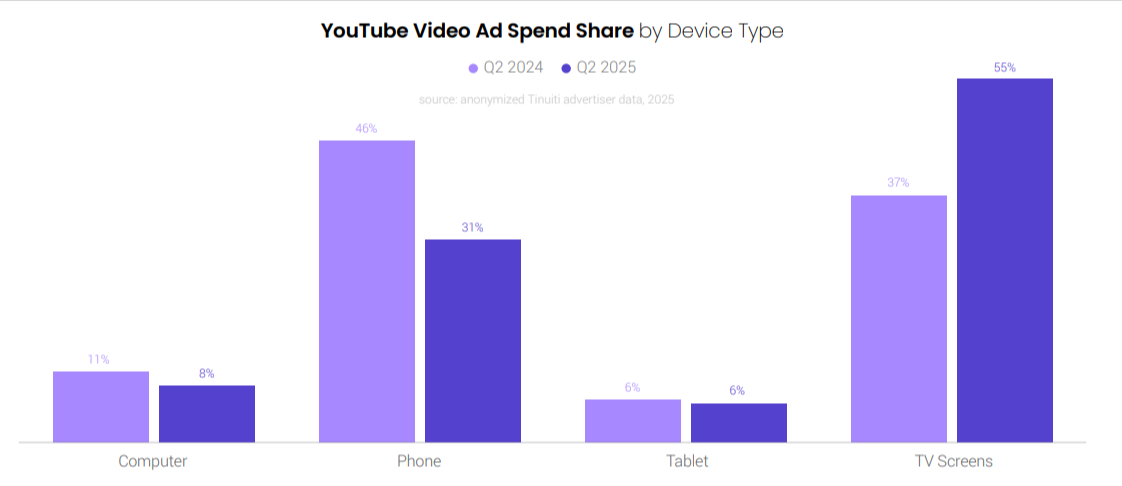
In Q2 2025, 55% of YouTube video ad spending went to TV screens, up from 37% a year earlier. Most of this growth came at the expense of phones, which dropped from 46% to 31%. Overall YouTube ad spending rose 9% year over year, but spending on TV screens jumped nearly 62%.
Since early 2024, brands using Google Demand Gen campaigns have been putting much more of their budget into video. In January 2024, video made up just 18% of spending, but after Google started shifting Video Action Campaigns into Demand Gen in Q2 and Q3 2025, video now accounts for about half of the spend. TV screen ad spending in Q2 2025 rose by nearly 62% Year over year.
Once again, click here to download the complete report.
Related Links


Stop the wasted ad spend. Get more conversions from the same ad budget.
Our customers save over $16 Million per year on Google and Amazon Ads.