We have updated this post. For the most up-to-date insights on interpreting Auction Insights in 2026 — including AI-driven campaigns, Performance Max visibility, and the impact of Google’s double-serving update — explore our latest guide: Google Ads Auction Insights: 2026 Guide to Tracking and Outmaneuvering Your Competitors (20th February 2026)
There is no better way to track your PPC competition than the Auction Insight Report on Google Ads interface. The struggle is always to stay ahead of your competitors and with insights from this report, you can take that extra step to improve your overall performance.
Reading the auction insight report
You can view the Auction insight report at campaign, ad group or keyword level. How much of in-depth information you want will decide, at what level you should view the report. If you check the report at campaign level you will get competitor insights for all the bidded keywords. Similarly for ad group level, you will get the insight for all keywords in that ad group.
For easy decision making, view the report at keyword level and identify where you are losing out on your audience. You can also consider grouping together keywords as themes to easily scan through the data.
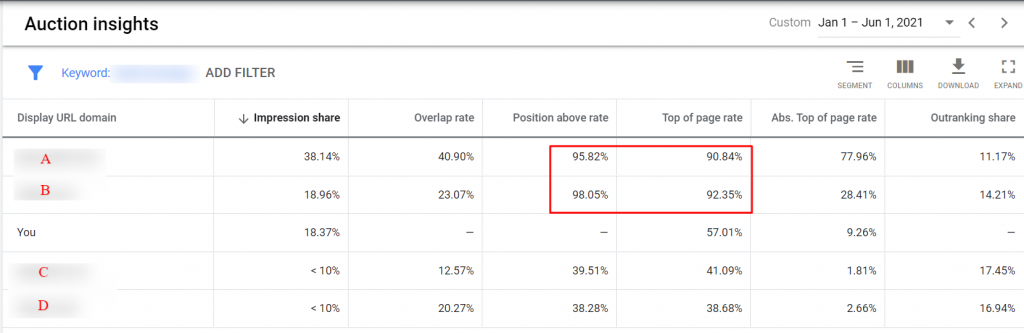
Here is an overall view of how to interpret the report
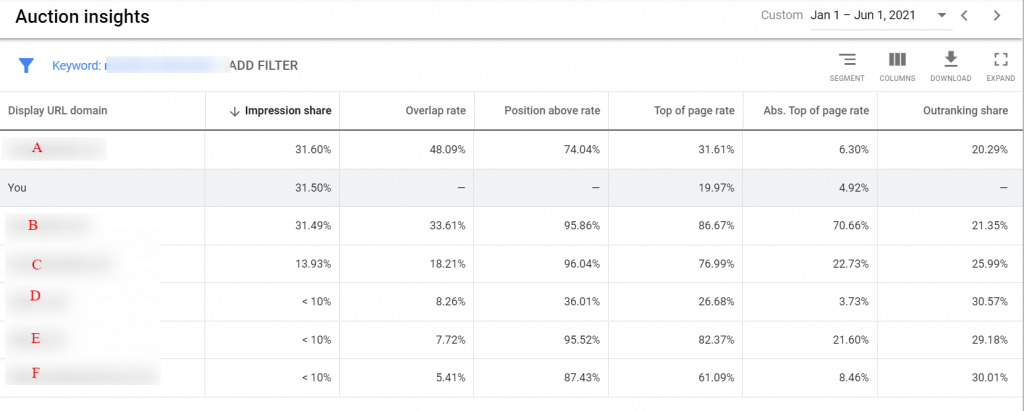
In the above report, competitor C has a lower impression share (13.93%) implying that it is appearing less in the auctions than we are. Its position above rate is highest at 96.04%, followed closely by competitor B. This would imply that the competitors B & C are heavily bidding on the keyword so that it ranks better, even though competitor C has a lower impression share.
Coming to absolute top of page rate, competitor B shows as the first ad above organic results, 7 out of 10 times. We can assume that their bidding strategy targets to be on the first page.
Understanding Auction Insight Report Metrics
Note: We are reviewing the metrics from auction insight report at keyword level here
Impression Share
With this metric, you can find how often your ad received an impression. It is calculated as impression received divided by the total eligible impressions. Impression share gives insight on how often your competitor’s ad received an impression as a proportion of the auctions your ad was competing for.
Factors such as the targeting settings, bids and quality scores, impacts the impression share. It can however, help understand whether a competitor is bidding for a keyword.
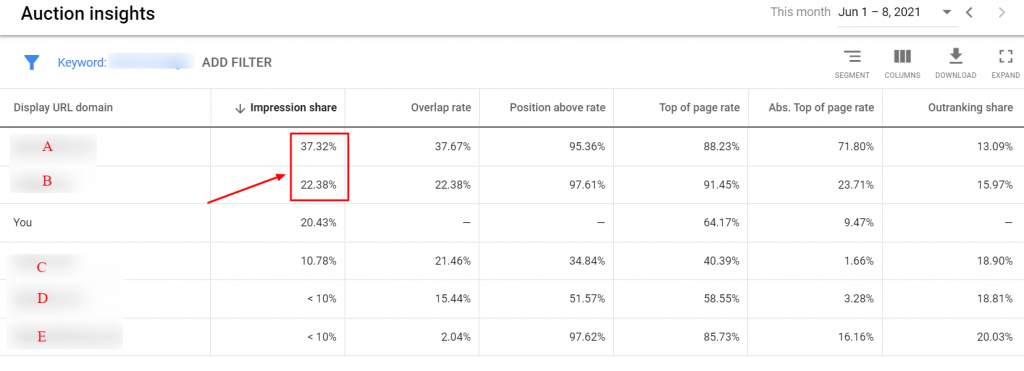
Like in the below example, the competitor (A & B) impression share is 37% & 22% whereas our impression share is 20%. It means that our ad was shown only 2 out of 10 times, while still being above competitors C, D & E
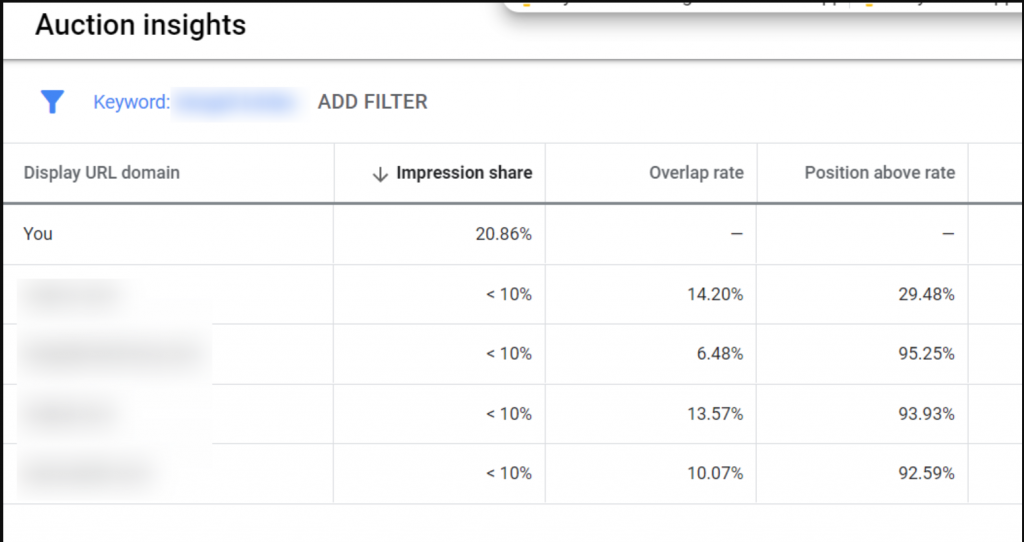
Let’s take another keyword to assess impression share data. In the snapshot below, we see that the competition is low. There is no competitor that has impression share higher than ours. And, for all eligible auctions, our ads ended up showing 2 out of 10 times.
Overlap Rate
This metric shows the competitiveness of your competitor, as it shows how often, other participants received an impression that your ad also received an impression for.
So if a participant has an 80% overlap rate, then 8 out of 10 times your ad shows, the competitor’s ad also received an impression. It indicates that they are also bidding for the same target keywords. So if it is a keyword that you wish to desperately drive traffic for, you need to make sure that you rank better than the competitor.
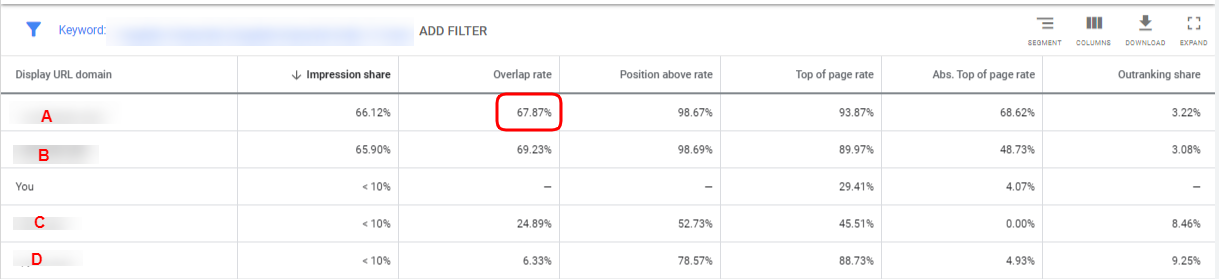
In the snapshot below, pulled from the keyword level, Advertiser A appears to have an overlap rate of 67%. It means that competitor A is bidding on the keywords having more or less similar targeting, bidding strategy and budget
Position above rate
It shows how often a competitor’s ad received a higher position than your ad during the same auction. It identifies the competitor ads shown along with yours and whether they are ranking better or lower than you.
In the above report, we see that competitor A has a pretty high position-above-rate at 95%, implying that they are ranking better than us for the select keyword. In order to replace them, optimize the bidding strategy could be one of the next action steps.
Top of Page Rate
Top of page metric shows how often the ad (yours or other advertisers) was shown at the top of page results, above the organic listing.
But note one thing, this data is independent of whether your ads showed at the same time or not. So it is likely that for competitor A (seen in the above snapshot with 90% top of page rate), your ad might or might not have shown at the same time
Abs. Top of page rate
It shows the percentage of impressions that received the first page ad slot, above the organic search results. This along with the Top of page metric can help understand how often your competitor is winning the auction.
Outranking Share
When your ad shows instead of your competitor’s it means that you outranked the competition. This detail is shown in the outranking share column.
It helps identify the number of times your ad (if you are watching the YOU row) ranked higher than your competition during the auction. If you changed your bidding strategy to outrank your competition, then this column reflects whether your approach has succeeded in outranking the competitor or not.
We conclude
Looking at just one metric will not help draw any conclusion. So its advisable to look at more than one metric to understand how your competitors are behaving.
Related Links:


Gigli saw wire
When your ad shows instead of your competitor’s it means that you outranked the competition. This detail is shown in the outranking share column.