Tinuiti, a US-based digital marketing agency, shared the Google Ads Benchmark Report for Q3, 2021. Based on anonymised Google programme performance data, here are some of the key findings from the study.
The complete report can be downloaded here.
Overall, Google Paid Search: Search Spend & CPC Remain Higher Than Pre Pandemic Level
Spending on Google search ads was up 34% Y/Y in Q3 2021. Despite the fact that average CPC growth slowed from Q2 to Q3, average CPC was still up 25% year over year for the quarter. While pricing comps are weakening, volume comps are still healthy for the majority of advertisers. As a result, in Q3, Google search ad clicks increased by only 8% Y/Y, compared to 4% growth in Q2.
In Q3 2021, Google search spend in the retail and eCommerce industries increased by 31% Y/Y, while spend in other industries increased by 40%. Google clicks grew 7% for retailers in Q3 2021, up from a 9% decline in Q2, while CPCs grew 23%.
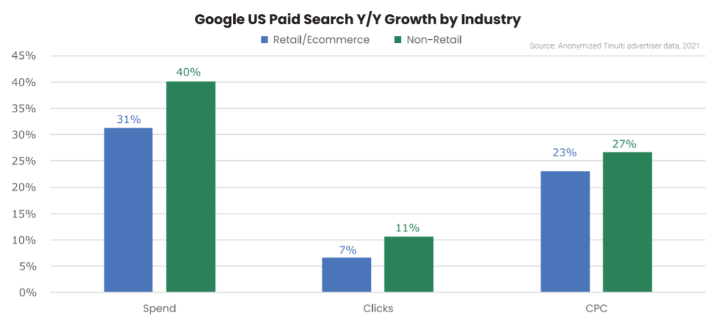
While CPCs for Google search ads increased by 23% year over year across all retailers in Q3 2021, CPC growth varied greatly by product category. Beauty product retailer CPCs rose the fastest on Google, with a rate of growth of 41% Y/Y in Q3 2021. Sports and recreation CPCs increased by just 14%, garment CPCs increased by slightly more than average at 24 percent, and pet supply CPCs increased by eight points to 27 percent from Q2 to Q3.
In Q3 2021, the share of Google search ad clicks generated by phones was highest for retailers and lowest for B2B marketers across the five major industries analysed for this study.
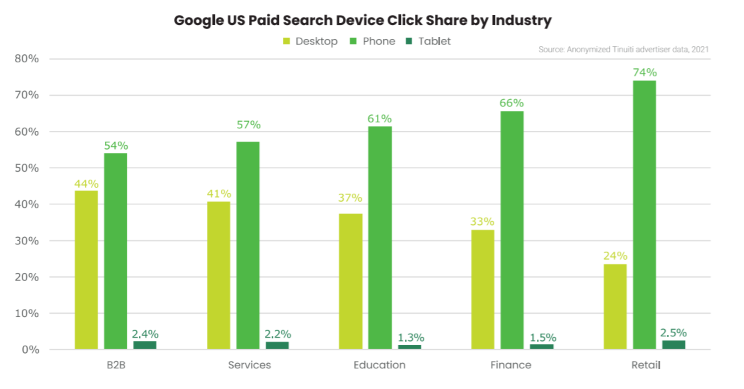
Phones accounted for 74% of retailers’ Google search ad clicks in Q3 & 54% of B2B advertisers’ Google search clicks in Q3. In Q3 2021, tablet traffic share varied from 1-2 percent across industries.
Google Text Ads: Substancial Text CPC Increase Slowed Click Growth
In Q3 2021, Google paid search text ad spending increased by 33% year over year, down from 45 percent in Q2. The average CPC for text ads increased by 33%, a minor decrease from the previous quarter’s CPC increase.
As Responsive search ads are now Google’s default ad type, for the first time in Q3 2021, it accounted for more than half of all Google text ad clicks.
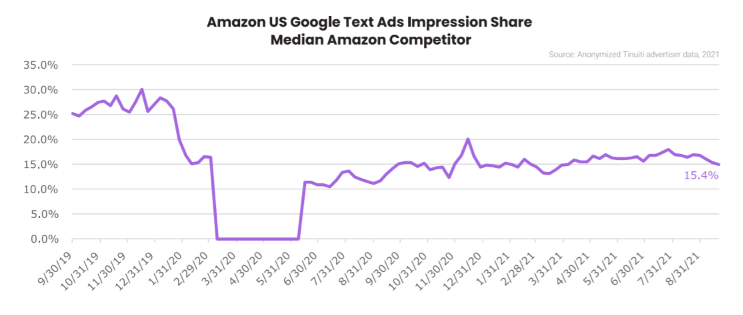
Though Amazon’s position in text ad auctions has grown in recent months, its share of Google text ad impressions remains roughly half of what it was before the pandemic. According to Google data for the median retail brand, Amazon’s proportion of Google text ad impressions climbed from roughly 12 percent to 17 percent between Q3 2020 and Q3 2021.
Between Q3 2020 and Q3 2021 Google advertisers saw a modest increase in the share of text ad clicks produced by phones. Phones accounted for a little under 68% of text ad clicks in Q3 2021 while Desktop & tablet click share fell about 30% and 2.5 % respectively over the same period. In Q3, phones delivered a bigger share of Google Shopping clicks than text ad clicks, as has been the case in the past.
If we talk about audiences, the percentage of Google text ad traffic generated by Similar Audiences targeting climbed from 11% to 17% between Q1 2020 and Q3 2021, while Affinity Audience click share went from 7% to 13%.
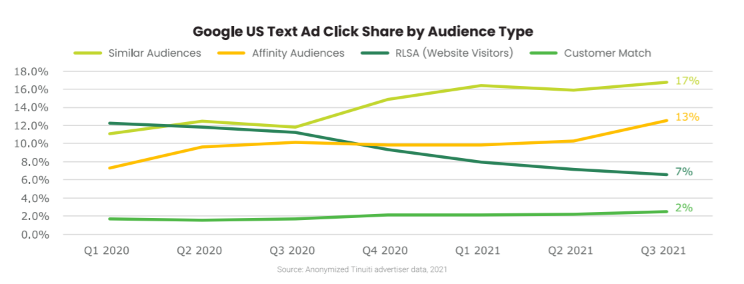
Over the same period, remarketing lists for search advertising (RLSAs), declined six points as big companies such as Apple reduced the functionality of cookies.
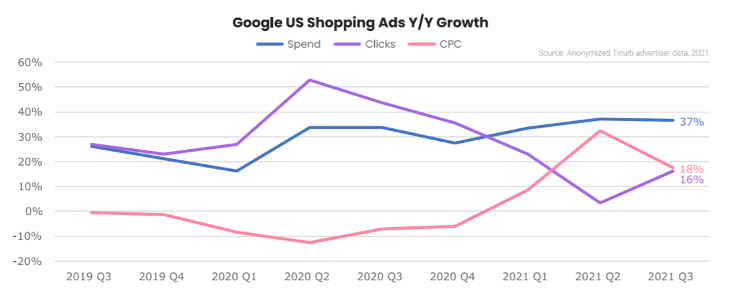
Google Shopping Ads: Clicks & Impression Soared Throughout
Despite an increase in ecommerce activity in early 2020, CPCs for Google Shopping ads declined 13% in Q2 2020, but eventually peaked at 32 percent year over year in Q2 2021. In Q3 2021, CPC growth slowed to 18% Y/Y but Shopping click growth accelerated to 16% Y/Y. Overall, shopping spending increased by 37 percent from Q2 to Q3 2021.
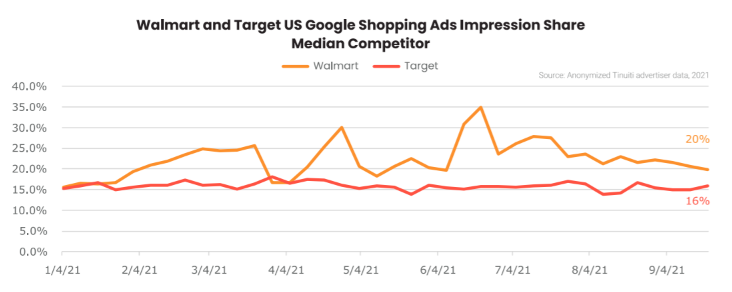
In Q3 2021, Amazon’s share of Google Shopping impressions reached levels its competitors haven’t seen since
the Q4 holiday shopping season in 2019. While Amazon has been relatively conservative in its return to text ad auctions, it has been more aggressive with its Shopping investment.
Even though Amazon has increased its presence in Shopping auctions, these two retail giants, Walmart and Target have retained their proportion of Shopping impressions.
If we talk about Google shopping clicks on devices, Phones generated a little over 76% of Google Shopping clicks in Q3 2021. Desktops accounted for 21% of Google Shopping clicks, while tablets accounted for just over 2% In the third quarter of 2021.
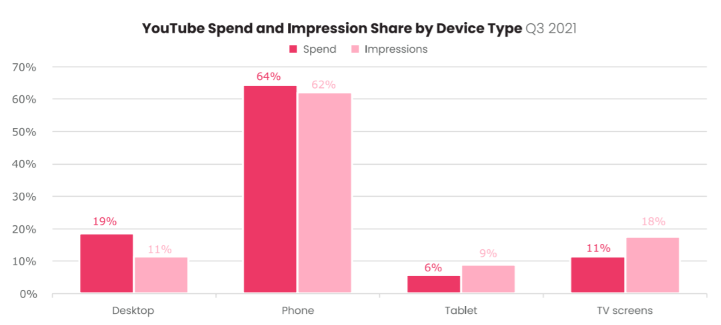
YouTube & Discovery Campaigns: Improved Impressions and Increased Visibility
In Q3 2021, spending on YouTube ad campaigns grew 43% Y/Y which was down from 52% growth a quarter earlier. YouTube ad impressions increased by 26% Y/Y in Q3 2021, compared to 12% in Q2 2021, while average CPM increased by 14% in Q2, compared to 35% in Q2.
On TV screens, YouTube ads accounted for 18% of all YouTube ad impressions but they commanded just 11% of YouTube spending. The average CPM of YouTube ads on desktops was more than twice as high as the average CPM of YouTube ads on TV screens, with desktop accounting for 11% of YouTube ad impressions and 19% of spend.
Google Discovery campaigns continued to attract new advertisers in Q3 2021. with adoption of the format up nearly 260% compared to the beginning of 2020. On Phone, Google discovery campaign ads accounted for 84% of Discovery ad spending. Tablets generated another 2% of Discovery spending, ,leaving 14% of spend to desktop.
On Google’s DV360 platform, iOS CPMs are holding up well against Android. While Apple’s recent steps to provide enhanced privacy on its devices have posed substantial issues in some areas of digital advertising, the impact on DV360 ad pricing appears to have been rather subdued over the last two years. In Q3 2021, relative CPMs for iOS placements against Android placements were just 7% lower than in Q4 2019.
Once again, to view the full Google Ads benchmark report, download it here.
Related Links


Stop the wasted ad spend. Get more conversions from the same ad budget.
Our customers save over $16 Million per year on Google and Amazon Ads.