Tinuiti, a US-based digital marketing agency, shared the Google Ads Benchmark Report for Q2, 2021. This report gives insights across paid search, Shopping, YouTube, and Discovery. Last year due to a pandemic, CPC, clicks, and spend growth suffered but in Q2 2021, advertisers saw a slow and steady rise in CPC and spend growth. In Q2, shopping spending also grew but shopping click growth slowed. Here are some of the key findings from the report.
The complete report can be downloaded here.
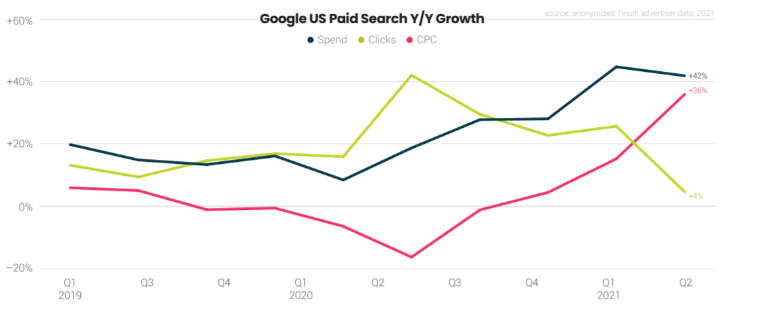
Google Paid Search Overall – Sharp Rise In CPC, Clicks And Spend Growth
Spending on Google search ads grew 42% Y/Y in Q2 2021. Google click and CPC growth saw much more dramatic changes between Q1 and Q2, however, as click growth slowed sharply to 4% Y/Y in Q2, while CPC growth shot up to 36% Y/Y.
As the US continues to reopen, different industries are seeing very different Google search ad trends. Retailers saw strong corresponding Google click growth as US eCommerce sales grew 44% Y/Y in Q2 2020. People started to look for physical retail store locations and location detail click traffic was on the rise.
In April 2020, location details click fell as far as 68% below but are now running nearly 40% above January 2020 levels.
In the same way, apparel and beauty brands saw relatively strong Google CPC and click growth among the retail industry. In Q2 2021, apparel Google search ad clicks rose 14% Y/Y, while CPCs grew 29%.
For all device types, desktop and phone CPC growth rates have trended similarly. Except for a brief jump in desktop traffic share at the end of Q1 2020, there has not been a significant shift in device usage.
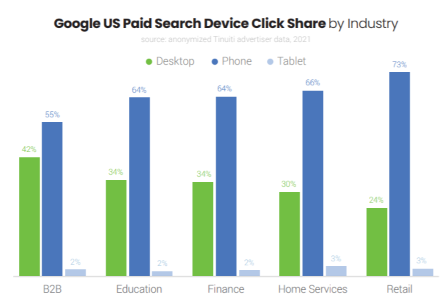
Phones generated 73% of retail Google search ad clicks in Q2 2021. It accounted for 66% of home services clicks and 64% of clicks across finance and education. However, Desktop generated 42% of B2B clicks and 24% of retail clicks. Tablet share of clicks was similar across industries at between 2-3%.
Google Text Ads – Overall Growth Accelerated Remarkably In Q2 2021
With eCommerce growing in demand, Google text ads face a weaker year ago spending comps than shopping ad formats but outpacing Google overall Q2 spending growth of 42%. Text ad click growth did slow while CPC growth accelerated significantly to 37% Y/Y.
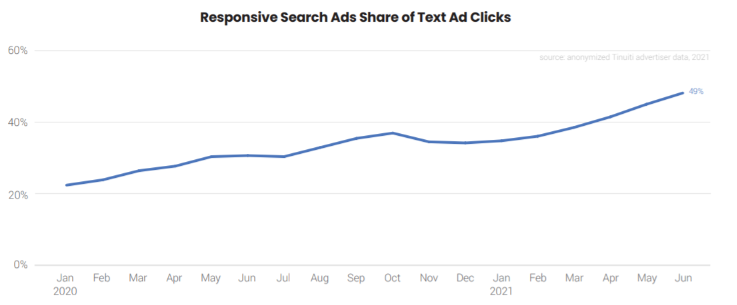
As Responsive Search Ads has become Google’s default text ad format since February 2021, it is quickly approaching a majority of Google text ad clicks. In June 2021, Responsive Search Ads accounted for 49% of Google text ad clicks, up from 35% in January 2021.
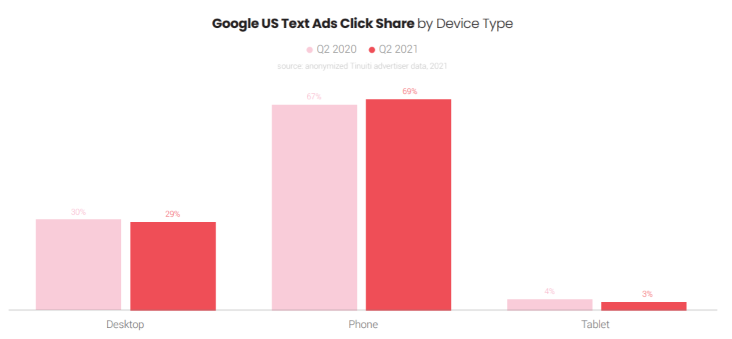
Though desktop’s share of Google text ad clicks ticked up at the end of Q1 2020, it fell by roughly a point to 29% between Q2 2020 and Q2 2021. Over the same period, phone click share rose nearly 69%, while tablet click share fell a point to just under 3%.
The share of Google text ad clicks produced by Remarketing Lists for Search Ads (RLSAs) and Similar Audiences traffic share fell between Q1 and Q2 2021.
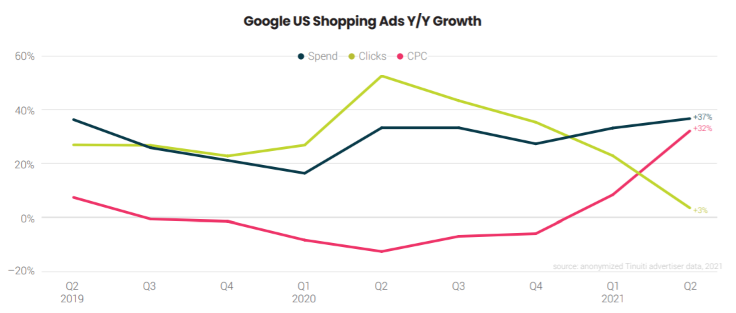
Google Shopping Ads – Shopping Spending Grew While Shopping Click Growth Slowed
A year earlier, Google Shopping spending grew 23 points faster than text ad spending but as advertisers reached the anniversary of that pandemic-driven traffic spike, Shopping click growth slowed to just 3% Y/Y in Q2 2021.
Amazon & Walmart saw an interesting change in shopping impressions at the end of Q2 2021. While Amazon’s presence in Shopping is not quite back to what it was prior to the pandemic, Walmart roughly doubled its share of Google Shopping impressions from the beginning of the year to the end of Q2.
For the first time, phones produced over 75% of Google Shopping ad clicks in Q2 2021. Desktop share of Shopping clicks slipped to 22% in Q2 2021, while tablet share was down over a point from a year earlier.
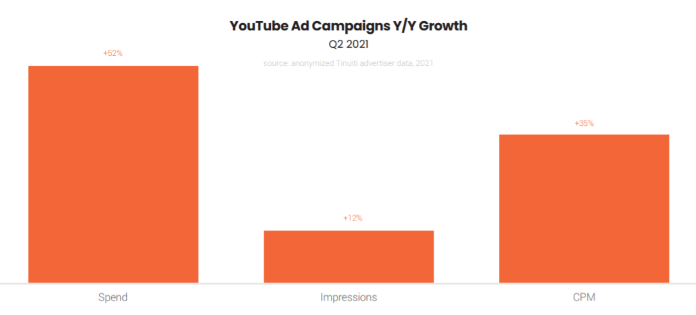
YouTube & Discovery Campaign – Spending Growth Picked Up Slowly
In the early pandemic, spending growth for YouTube ads slowed to single digits, however, it was picked up quickly in the back half of 2020 and has been strong over 2021. In Q2 2021, YouTube spending was up 52% Y/Y among Tinuiti advertisers. Advertisers are finding YouTube ads much more expensive, with CPMs rising 35% Y/Y in Q2 2021.
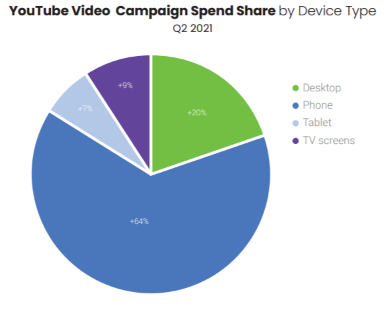
If we talk about devices, whether smart TVs or those connected to the internet by a streaming device, have become a significant source of YouTube viewers and command an appreciable share of YouTube ad spending at 9% in Q2 2021. , Tablets also make a relatively strong contribution to YouTube traffic and generate 7% of spend.
Since the time Discovery ads became available to all advertisers globally in Q2 2020, the number of brands running Discovery campaigns increased by 228%. Discovery campaigns have become a useful option for brands looking for incremental traffic across Google’s Gmail, YouTube, and Discover properties.
Phones accounted for 84% of Discovery campaign budgets in Q2 2021 and Desktop produced 14% of Discovery ad spending in Q2 2021, while tablets produced 1%.
Once again, to view the full Google Ads benchmark report, download it here.
Related Links


Stop the wasted ad spend. Get more conversions from the same ad budget.
Our customers save over $16 Million per year on Google and Amazon Ads.