Tinuiti’s Google Ads Benchmark Report for Q1, 2021 gives insights across paid search, Shopping, YouTube, and Discovery. Due to pandemic, CPC, and click growth both were suffering in March last year, but took a jump this year relative to Q4, driving on the strongest spend growth of the last ten quarters. Here are some of the key findings from the report.
The complete report can be downloaded here.
Overall Google Paid Search – CPC Growth Gaining New Strength
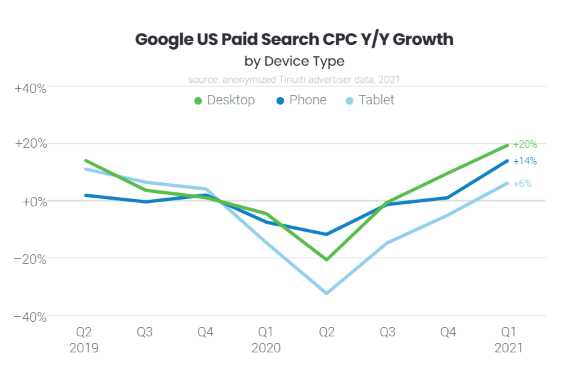
As we see the year-ago comparison, the last Q1 marked the start of the pandemic, and advertisers were heavily impacted by significantly lower average CPC. With brands now overtaking those comparisons, the average CPC grew 15%, pushing spend growth up to 45% from 28% in Q4.
With regards to the device types, Q1 2021 marked the first quarter since Q4 2019 in which every device type saw positive year-over-year growth in Google paid search CPC.
While we look at different industries like B2B, Education, Retail, and Home services, the share of Google paid search clicks coming from phones differs meaningfully in comparison with desktop computers. Retail & Home services saw above 70% Google paid search click share coming from phones.
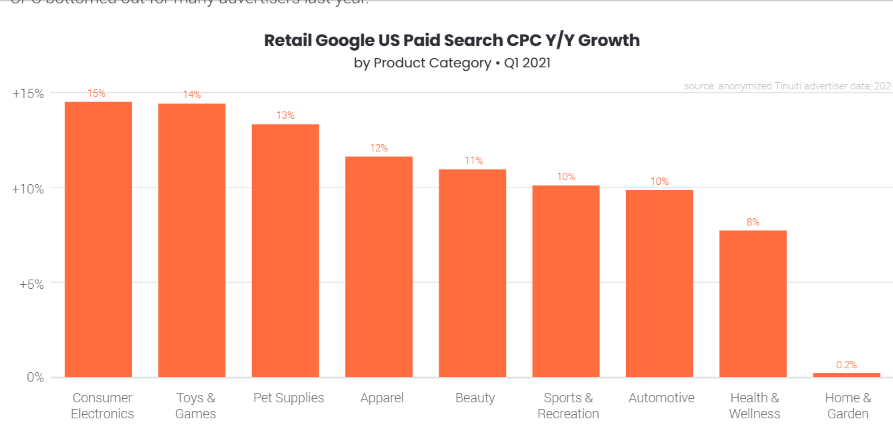
Due to Pandemic, consumers were at home and ordering most of the items online. This boom in online purchasing has benefited retail giants like Amazon & Walmart to expand their paid search impression share throughout Q1 in a number of product categories. This has caused CPC to go up year over year across many major retail product categories.
Google Text Ads – Significant Growth From Q4 2020 To Q1 2021
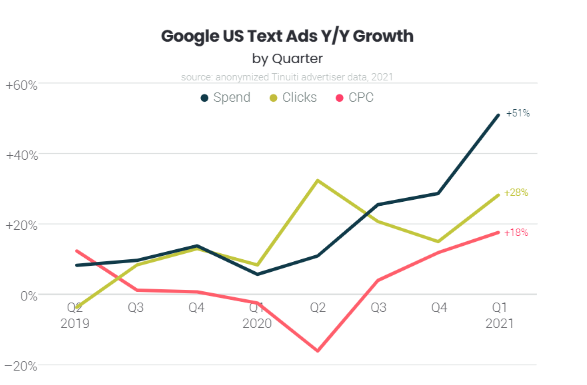
For Tinuiti advertisers, year-over-year text ad CPC growth has been positive since Q3 2020. It has been remarkably stimulated to 18% in Q1 2021.
In March 2021, Responsive search ads accounted for 41% of text ad clicks, up from 24% at the beginning of 2020. Dynamic search ads click share remained remarkably stable since the beginning of 2020, fluctuating between 7% and 10% over that time.
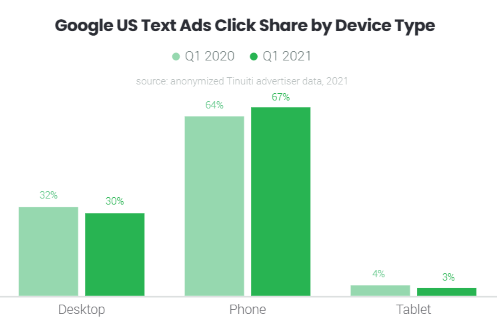
In comparison to desktop and tablet click shares for Google text ads, phone click share rose from 64% to 67%. In the same line, similar audiences or remarketing lists for search ads have also grown in click share over the last year,and in Q1 2021 16% of text ad clicks were attributed to this type compared to 11% last Q1.
Google Shopping Ads – CPC Growth Recovery At A Slower Pace
For the first time, Google Shopping ads CPC increased year-over-year since Q2 2019. In Q1 2021, Shopping CPC growth vaulted to 9% growth from a 6% year-over-year decline in Q4.
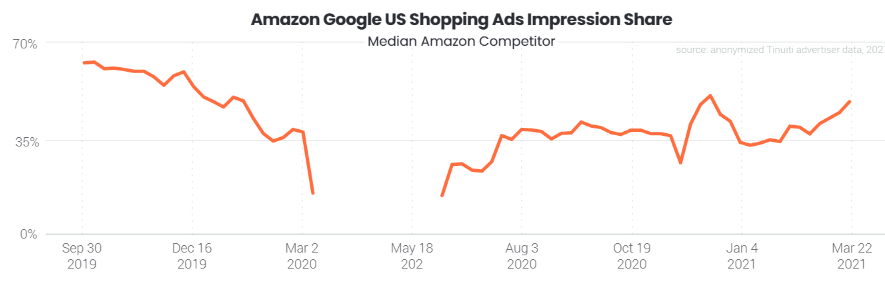
Amazon & Walmart both have made more competitive auction across many product categories thus became quite widespread in terms of Shopping impression share throughout the first quarter of the year.
Walmart’s impression share against the median competitor grew from 17% at the beginning of January all the way up to 33% by the end of Q1. Amazon’s impression share in Google Shopping auctions hit 49% against the median US retail competitor at the end of Q1. With Amazon and Walmart both ramping up impression share over the first quarter of the year, 2021 is shaping up to be highly competitive for retail advertisers in Google Shopping.
Google shopping click share on phone increased by 74%. The desktop share held roughly steady, while tablet share declined from 4% to 3% over the last year. Shopping share for retailers increased by 58% on phones whereas it did decline on tablets from 52% to 51%.
Google Video Campaign & Discovery Campaign – Growing In Demand Year-Over-Year
Brands are making sure to gain customers attention through video platforms. Spend on Google video campaigns targeting YouTube has grown 53% year over year with a 56% increase in impressions. Skippable in-stream video ads accounted for 91% of YouTube spend in Q1 2021. YouTube audio ads which were released out of testing in November 2020, accounted for 2% of video campaign spend in Q1.
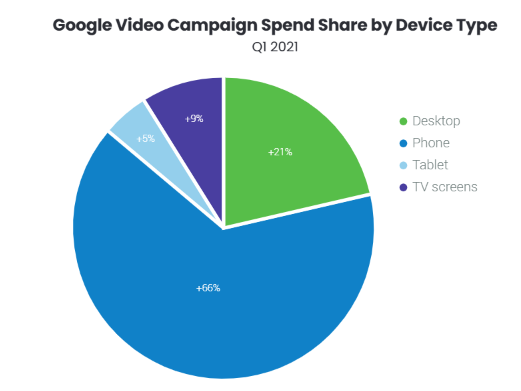
Many YouTube users access the video platforms on their mobile devices. Due to that, in Q1 2021 66% of all spending was attributed to phones, compared to 21% for desktop and 5% for tablet devices.
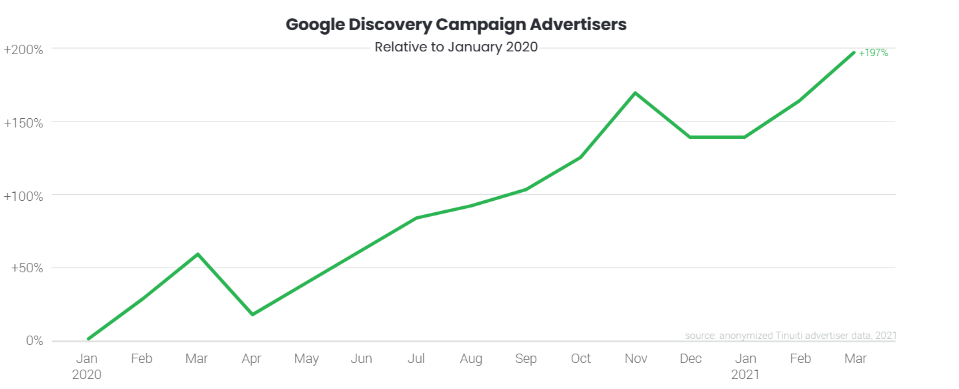
Now let’s talk about Discovery campaigns. These were launched in 2019 and offer advertisers the ability to target inventory across Discover, YouTube, and Gmail. Since the beginning of 2020, the number of advertisers using Discovery Campaigns has increased, growing 197% from January 2020 to March 2021.
While advertisers aren’t able to segment Discovery campaign performance by placement, device segmentation is available to get a glimpse how users are interacting with these ads. Over the last five quarters, phone spend share has remained above 80% for Discovery campaigns.
Once again, to view the full Google Ads benchmark report, download it here.
Related Links


Stop the wasted ad spend. Get more conversions from the same ad budget.
Our customers save over $16 Million per year on Google and Amazon Ads.