Identifying your competitors and knowing how their ads are performing vis-à-vis yours can help you take strategic steps towards improving your competitiveness. Google Ads Auction Insights Report is the key to keep track of your competition.

[This post was updated on 22nd July 2020 with new images as per the new Google Ads interface.]
This post will take you through all the components of the report and how to interpret the data.
How to access Google Ads Auction Insights Report?
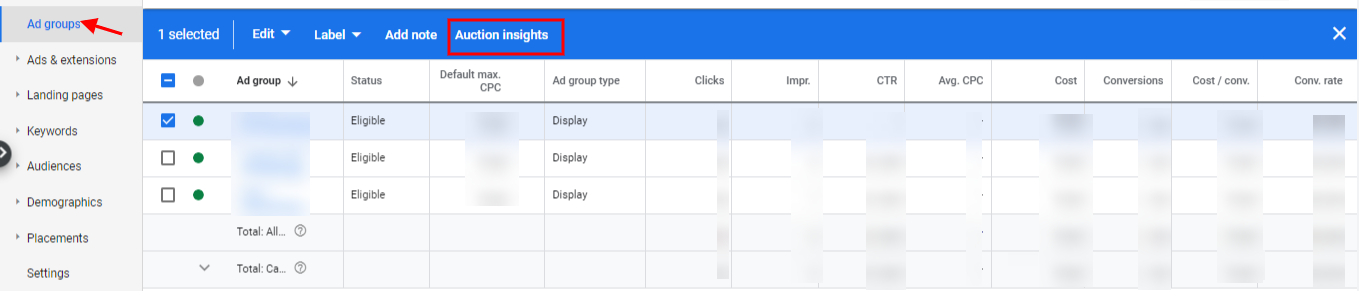
Step 1: Select the campaign, ad group, or keyword for which you wish to check the competition strength. Now check the box next to each item ( select ad groups, keywords, or campaigns) and click on Auction Insight.
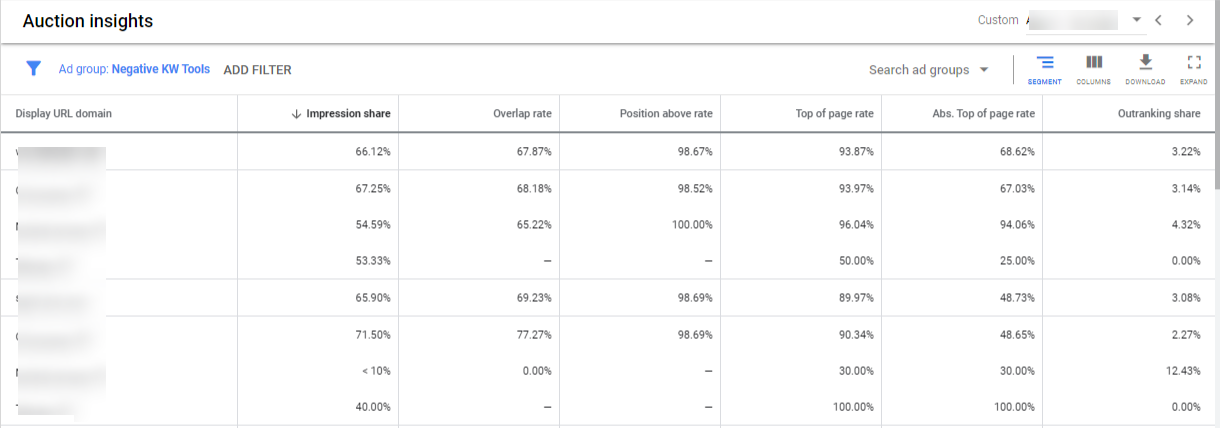
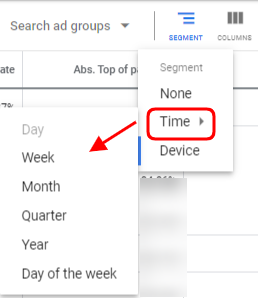
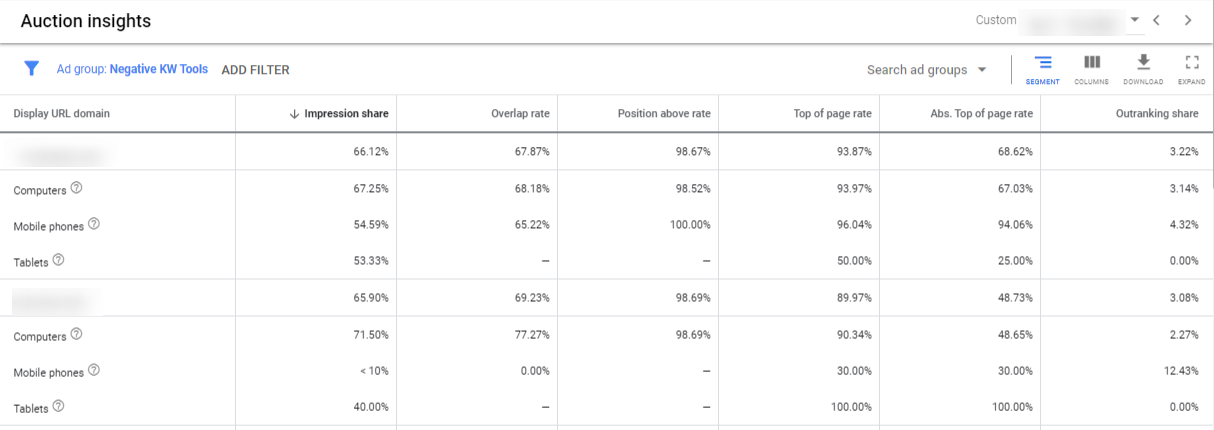
Step 2: You will see the report as shown below. If you wish you can choose to segment your report basis ‘Device’ or ‘Time’ to get more insight. This can be done by selecting Device or Time from the segment drop-down menu.
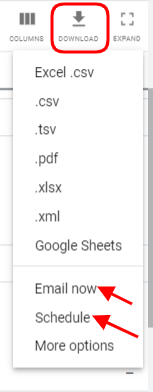
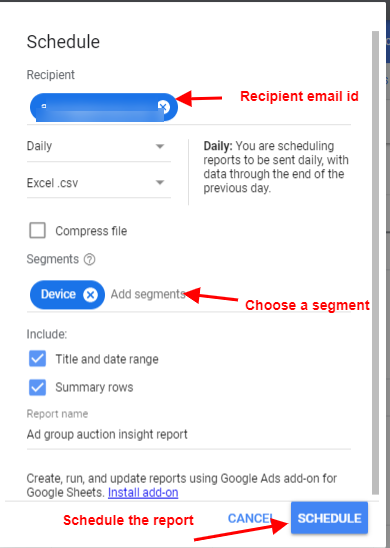
You can also export the report or schedule the report to be shared on your email id. You can do so by clicking on the download sign in your Google Ads Auction Report:
Let’s see how segmenting the data by device or time will break down the report:
You can use the auction report to identify which device is being used by competitors for a specific keyword or set of keywords. It can help you decide a better device strategy and you can increase your bids for the device type your competition shows for.
Similarly, if you segment the data by time which is further bifurcated into a week, month, quarter, year, and day of the week, you can get insight into whether your competitor is appearing more often on a certain day(s) or hour(s). You can decide to increase your bids during days when your competitor is highly competitive and lower your bid when they are lying low.
Now that you have the report and insights in front of you, how do you interpret your Google Ads Auction Insights Report?
As you can see the report displays data under 6 metrics. Each of these columns reflects different information. We will take each up and discuss what needs they meet.
Impression share
With this metric, you can know how often your ad received an impression and is calculated as impression received divided by the total eligible impressions. It also tells you about how often your competitor’s ad received an impression as a proportion of the auctions your ad was competing for. With this information, you can figure out how your ad is reaching out to people. You can analyze whether by increasing your bids there has been an improvement in your impression share.
Avg. position
This metric shows the average position of your or other advertiser’s ad after a successful auction. It does not show the average position of your ad versus your competitor’s, but when each received an impression irrespective of whether it was during the same SERP inquiry.
Note – Average Position metric is no longer available in Google Ads. Learn Google Ads announcement here regarding the same.
Overlap rate
This metric shows the competitiveness of your competitor, as it shows how often, other participants received an impression that your ad also received an impression for. So if a participant has an 80% overlap rate, then 8 out of 10 times your ad shows, the competitor’s ad also received an impression, indicating that they are also bidding for the same target keywords. So if it is a keyword that you wish to desperately drive traffic for, you need to make sure that you rank better than the competitor. To find this out, go to the keyword level auction insight report.
Like in the snapshot below, extracted from the keyword level, Advertiser A appears to have an overlap rate of 67%.
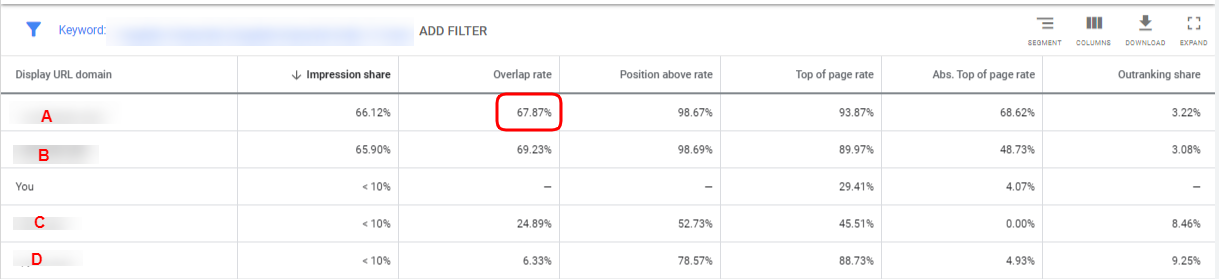
This makes clear that though the overlap rate isn’t much, yet the number of times the advertiser’s ads do show for the keyword, they rank better than us.
Position above rate
It shows how often a competitor’s ad received a higher position than your ad during the same auction. This metric is a better reflection of which competitor’s ad is getting displayed along with your ad and whether they are ranking better or lower than you. If they are ranking better than you, then you might want to optimize your bidding strategy.
Top of page rate
This metric shows how often the ad (yours or other advertisers) was shown at the top of page results, above the organic listing.
Outranking Share
With this metric, you can find out the times your ad ranked higher than the advertiser’s during the auction. So, if you made changes to your bidding strategy to outrank a specific competition, then this column reflects whether your approach has succeeded in outranking the competitor or not.
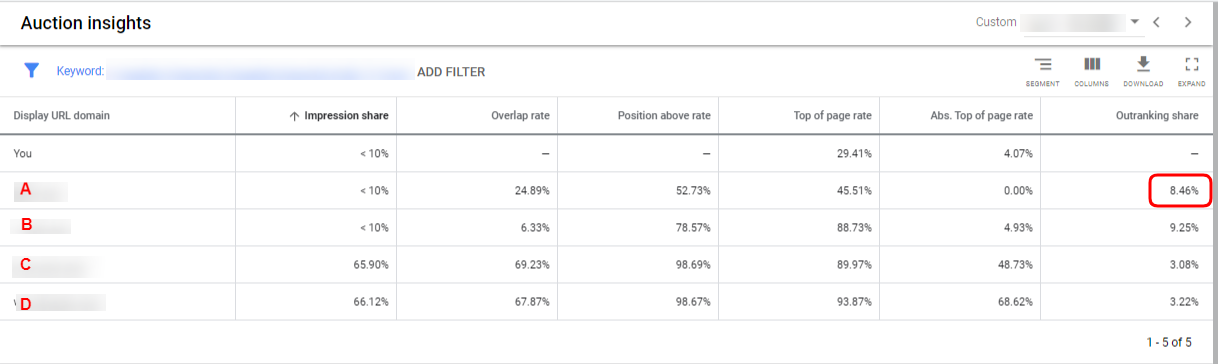
As in the above example, for Advertiser A the outranking share is low at 21% which implies that the advertiser ranks higher in most of the auctions. As you can outrank only one competitor at a time with Target Outrank Share, you can start with Advertiser A in this case and increase your bids to rank better than it. Know more about Target Outrank Share.
Related Links:


Stop the wasted ad spend. Get more conversions from the same ad budget.
Our customers save over $16 Million per year on Google and Amazon Ads.