Energize your digital advertising strategy with Tinuiti’s Q4 report. This analytics-driven examination of Google, Meta, Amazon, and other platforms, utilizing anonymized campaign data, offers actionable insights for making informed decisions.
The complete report can be downloaded here.
The Platform Puzzle: Putting Together the Pieces of Q4 2023
Digital ad platforms like Facebook, Instagram, Amazon Ads, Google, and YouTube saw a robust finish to 2023, with spending growth accelerating significantly in Q4.
Although Facebook experienced a slowdown in growth from Q3 to Q4, it still observed the most substantial increase in growth from the first quarter to the last.
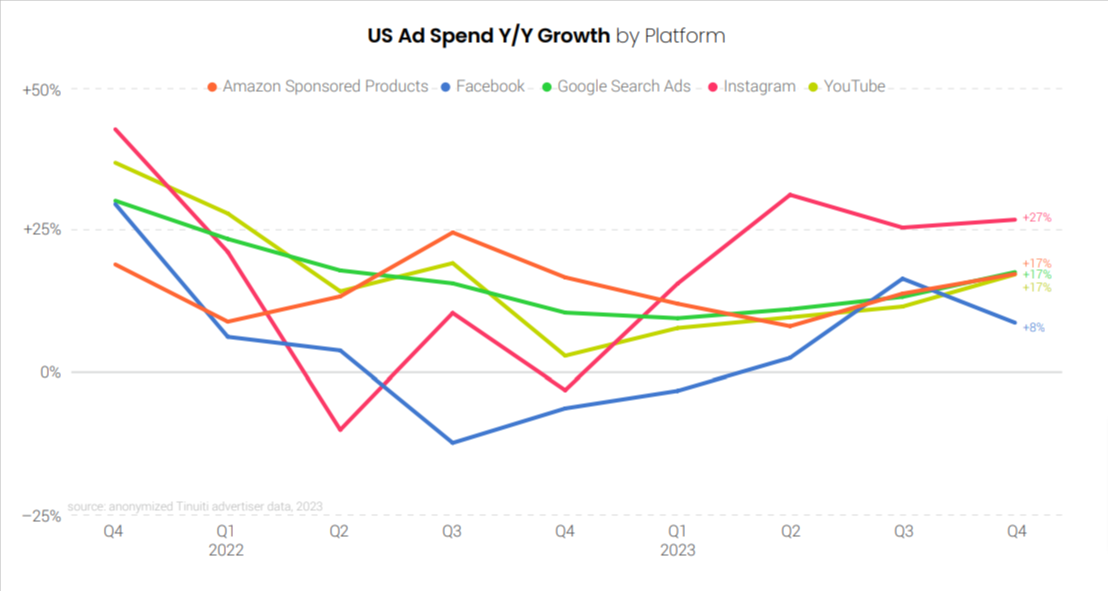
Throughout 2023, both, Facebook and Instagram witnessed the growing significance of newer inventory sources. Advertisers have increasingly utilized Meta’s AI-powered Advantage+ shopping campaigns. Although Advantage+ shopping campaigns were introduced in Q3 2022, they already constituted 27% of retail Meta spend by Q4 2023.
Google also shifted its focus to AI-driven campaigns, replacing Smart Shopping with Performance Max in Q3 2022 and transitioning Discovery to Demand Gen in Q4 2023. Between the two, Performance Max has made a more significant impact, being embraced by over 90% of brands that run shopping listings with Google.
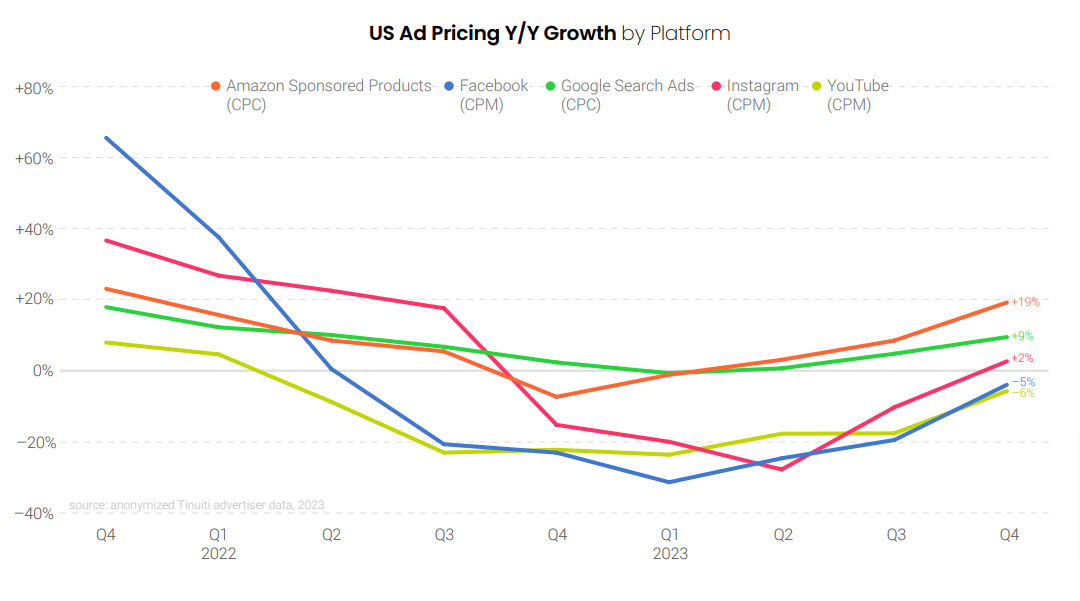
In Q4 2023, Amazon Sponsored Products, Facebook, Instagram, Google search, and YouTube experienced greater pricing growth than Q3, but Google witnessed a double-digit growth. Although the average CPC growth rates for Google search ads and Amazon Sponsored Products didn’t decrease as much as the CPM growth rates for Facebook and Instagram in the last six quarters, they did turn negative.
Looking Back at the 2023 Holiday Shopping Season
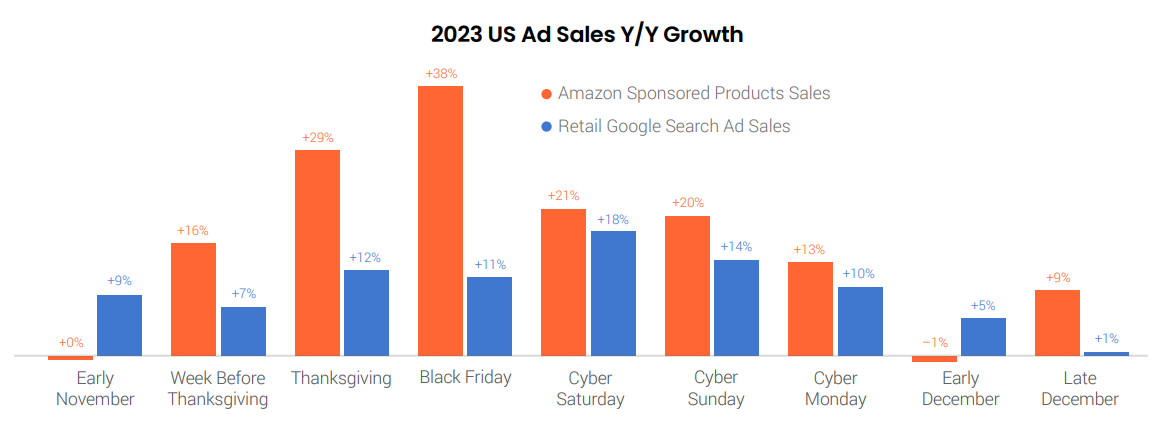
17% advertiser spending growth across Google Search & Amazon Sponsored Product Ads in Q4, but consumer demand cooled in December despite strong November sales.
From Thanksgiving to Cyber Monday, both Google and Amazon ads saw significant sales growth attributed to ads. Amazon ads peaked with nearly 40% year-on-year sales growth on Black Friday, while Google observed its highest sales growth for retailers the next day at 18% year-on-year.
Recently, brands observed a notable shift in the factors influencing holiday sales through digital ads, mainly due to a slowdown in the growth of average order value (AOV). From November to December 2023, Google search AOV remained relatively steady year over year. The average growth in Google search ad AOVs for the fourth quarter was only 1%.
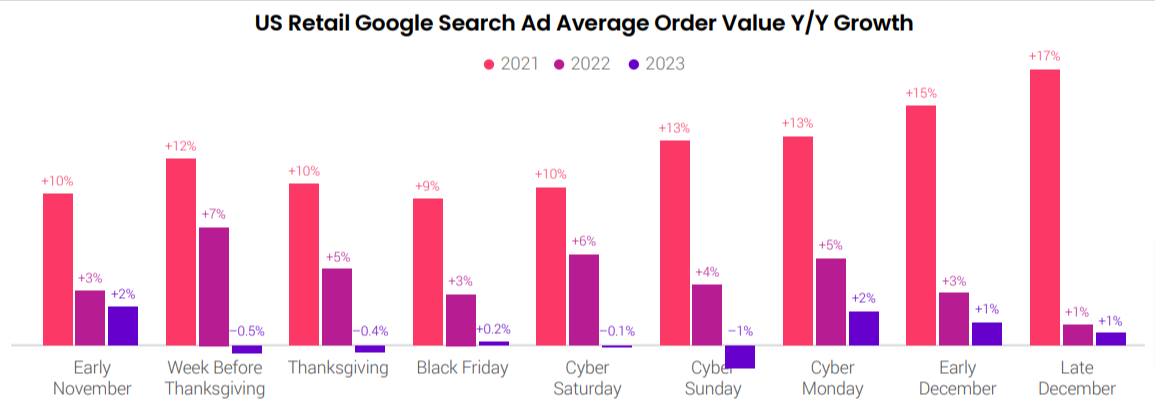
Sales per click increased for both Google search and Amazon Sponsored Products throughout a significant portion of December. However, Google experienced a sharp decline in sales per click six days before Christmas, whereas Amazon maintained relatively high sales per click for several more days.
Marketers should consider these changes in the value of ad clicks and make necessary bid adjustments and other optimizations during the holiday season.
CPCs Improved Across Google Text Ads, Search Ads & Retail Google Search Ads
CPCs increased across all ad types. 91% of brands utilized PMax during the peak holiday shopping season which contributed to increased spending on Google Shopping ads
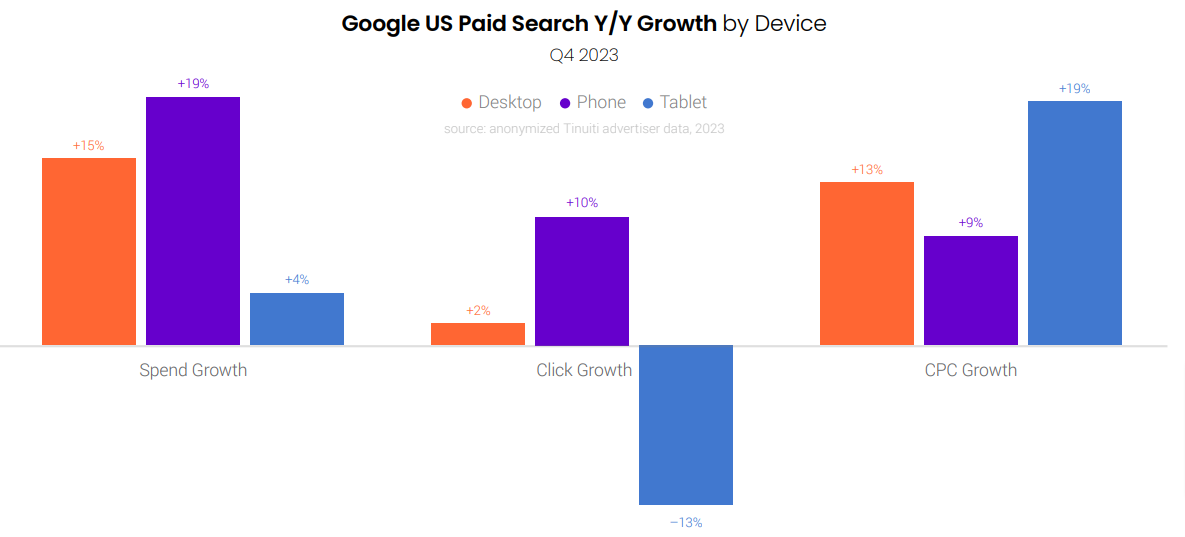
Strong holiday demand in November contributed to a 17% Y/Y increase in spending on US Google search ads during Q4 2023. Google click growth remained constant at 8% Y/Y, while there was a 9% Y/Y acceleration in CPC growth.
Spending on Google search for desktops and laptops increased by 15% Y/Y with a 2% rise in clicks due to a 13% increase in CPCs. Tablet CPCs increased by 19% Y/Y, resulting in a 4% spending increase.
Throughout Q4 2023, retailers’ Google search ad CPCs were up by an average of 36% over 2019 levels. Text ad CPC growth accelerated for the third quarter in a row, reaching 16% Y/Y in Q4.
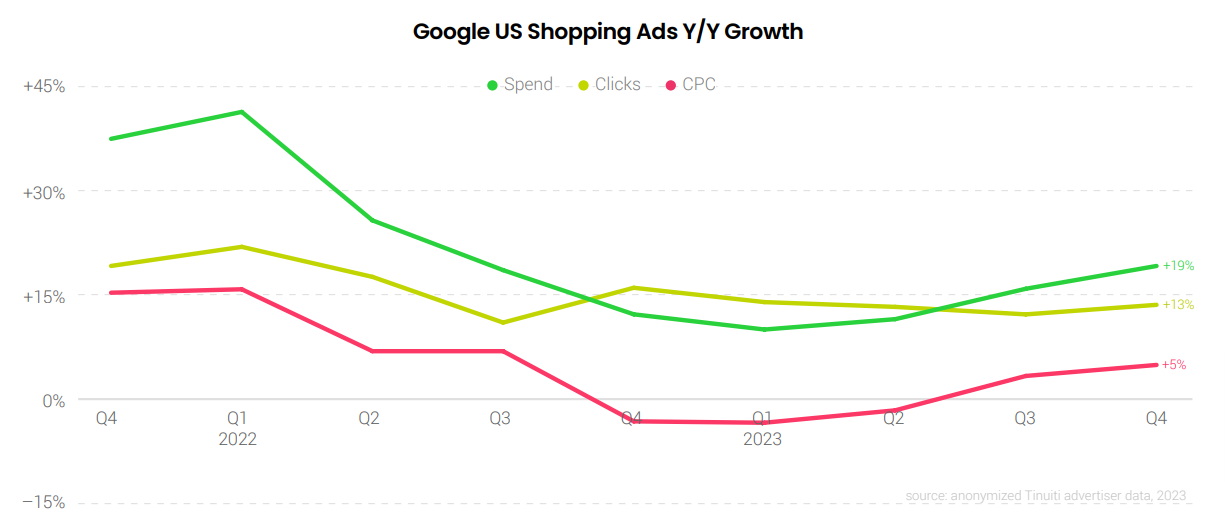
Expenditure on Google Shopping and Performance Max campaigns increased by 19% year-on-year in Q4 2023. The growth in CPC for Google Shopping accelerated to 5% year-on-year in Q4, after having run in negative territory for the first two quarters of the year.
CPC growth for text ads accelerated for the third consecutive quarter, reaching 16% year-on-year in Q4. Spending on Google text ads increased by 16% year-on-year in Q4 2023, compared to 11% growth in the previous quarter.
Spend Growth for Amazon Sponsored Products & Brands Accelerates
Sponsored Brands CPC growth remained muted and Amazon Sponsored Products CPC grew more than 10% across most product categories.
Sponsored Brands CPC growth reached its peak at 6% in November and only increased by 2% year over year in the final quarter, in contrast to the 19% growth observed for Sponsored Products.
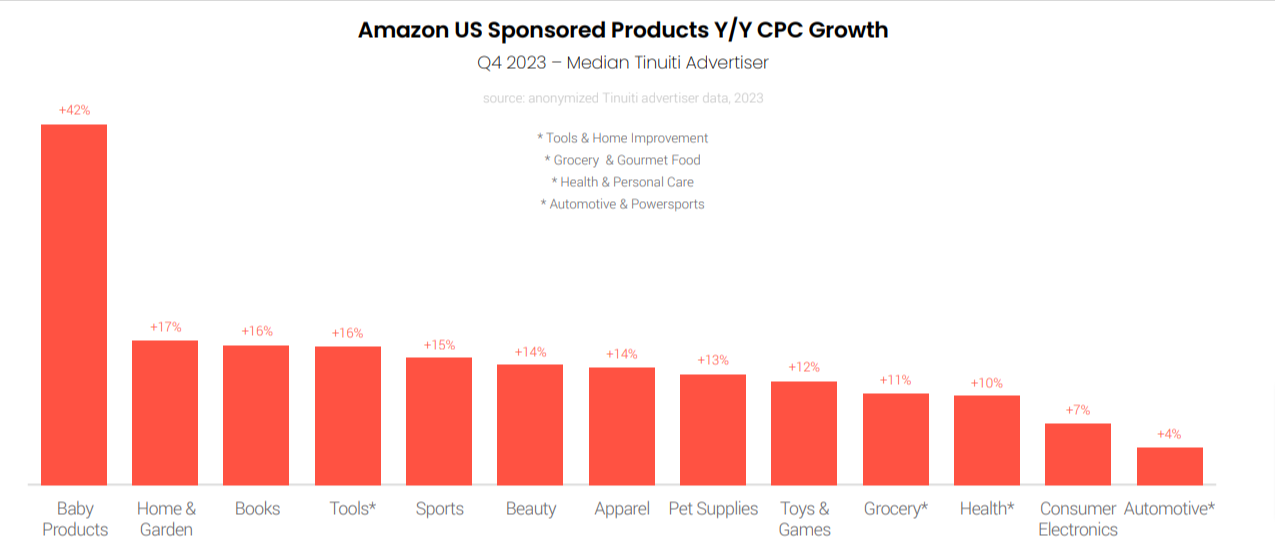
Throughout Q4, Amazon advertisers experienced a 16% year-over-year growth in Sponsored Products CPC in each month. Sponsored product CPC growth topped 10% for eleven out of thirteen product categories in Q4.
Spend growth for Walmart Sponsored Products increased in each quarter of 2023, reaching its peak at 62% year-on-year in Q4 after 55% growth in Q3. CPC growth exceeded 30% in both the last two quarters of the year. The average CPC of Walmart-sponsored product ads rose 46% year over year in December, the strongest growth of the year.
The majority of Walmart search ad clicks, originate from the mobile app. In Q4 2023, 75% of all Walmart search ad clicks were credited to the app, causing a decline in the shares of both desktop and mobile web. Mobile web clicks represented 15% of search ad traffic in Q4, while desktop clicks constituted the remaining 10%.
Big Win for Demand Gen, Huge Impression Jump, Offset by Lower CPMs
Spending growth accelerated modestly for the Discovery/Demand Gen campaign. Stronger CPM trends drive spending growth for the Google Display Network.
Spending on standard YouTube ad campaigns was up 17% Y/Y in Q4 2023. YouTube impressions were up 25%, while average CPM fell 6%. YouTube is also generating ad impressions from Demand Gen and Performance Max campaigns, including on YouTube Shorts. In Q4 2023, video accounted for about 4% of PMax spending.
In October 2023, Google began migrating its Discovery campaigns to the new Demand Gen model. The Demand Gen transition did seem to give adoption rates a boost in Q4 2023.
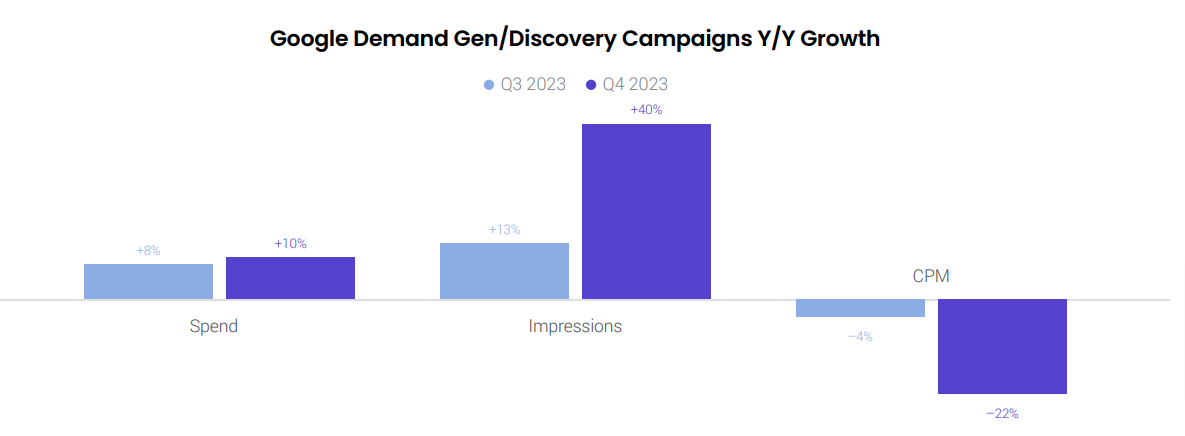
For advertisers running Discovery/Demand Gen campaigns in both 2022 and 2023, spending growth accelerated modestly from 8% Y/Y in Q3 2023 to 10% in Q4. Due to the transition from Discovery to Demand Gen campaigns, Impression growth jumped from 13% Y/Y in Q3 to 40% in Q4.
In Q4 2023, advertiser spending on the Google Display Network increased by 6% year-on-year. GDN impressions decreased by 10% year-on-year in Q4, an improvement from an 8% decline in Q3. However, CPMs surged by 17% year-on-year in Q4, surpassing a 10% increase in Q3. Google Display Network CPMs fell 5% Y/Y in the first quarter of the year, but CPM growth has accelerated in each of the quarters since.
Once again, click here to get the complete Digital Ads Benchmark Report.
Related Links


Stop the wasted ad spend. Get more conversions from the same ad budget.
Our customers save over $16 Million per year on Google and Amazon Ads.