Tinuiti, a US-based digital marketing agency, shared the Google Ads Benchmark Report for Q4, 2021. Here are some of the study’s significant conclusions, which were based on anonymized performance data from Google programmes.
The complete report can be downloaded here.
Google Paid Search, In General: E-commerce & Retail Search Spending Continues to Increase
In Q4 2021, Google search ad spending increased by slightly over 30% Y/Y, with clicks up 11% and CPCs up 18%. Google search spending has increased by more than 30% for the fourth quarter in a row. Prior to the pandemic, Google’s official ad revenue growth has been below 30% since 2011.
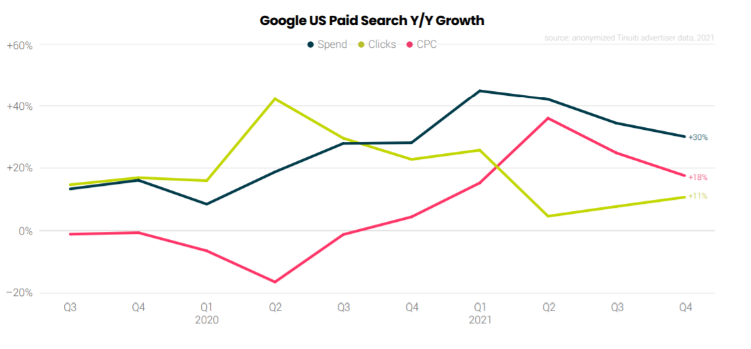
Even though retail and eCommerce has been a relative bright spot for Google since the early months of the pandemic, retail brands continued to increase their investment in search ads. Google search spending for retail and eCommerce was up 28% Y/Y in Q4, with clicks up 8% and CPCs running 19% higher. Non-retail Google search spending increased 33% on 17% click growth and 14% higher CPCs.
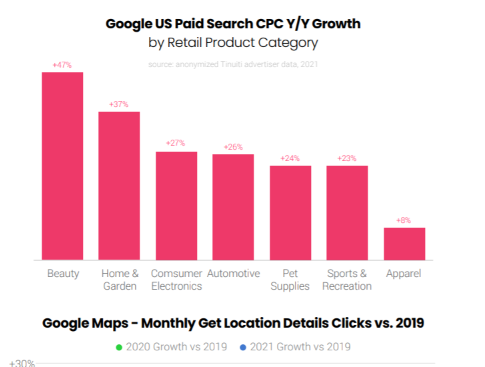
CPCs for retailer Google searches in Q4 2021 were not just higher than 2020, but also much higher than 2019. Beauty product advertisers saw CPCs rise 47% Y/Y in Q4, up from 41% in Q3. Home and garden CPC increases were likewise high, at 37%, while apparel CPC growth was the slowest, at 8% Y/Y in Q4, down from 24% in Q3.
The highest increase in phone share of Google search ad clicks occurred on Black Friday. Over November and December, Google search ad clicks generated by phones were up to three points compared to 2020, and up to five points on Black Friday.
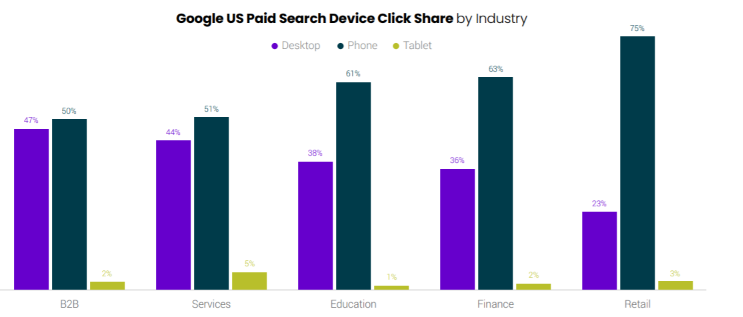
In Q4 2021, phones contributed the most traffic share to retailers, accounting for 75% of all Google search ad clicks. In the fourth quarter of 2021, phones accounted for just half of all Google clicks for B2B advertising. Between the two, phones accounted for 63% of Google clicks for financial services advertising and 61% for education ads.
Google Text Ad : Overall CPC Growth Remains High
In Q4 2021, Google text ad spending increased by 26% year over year. For the fourth quarter, text ad CPCs climbed faster than the total Google average, but growth slowed from 33 % Y/Y in Q3 to 23 % in Q4.
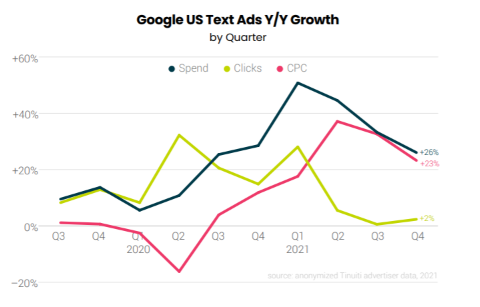
Advertisers have noticed a significant increase in CPCs for Google keywords featuring their own brand name. On Google, brand CPCs increased 46% year over year in Q3 2021, while non-brand CPCs increased 24%. However, in Q4, the difference closed significantly, with brand CPCs up 26% vs 23% for non-brand CPCs.
The Responsive Search Ads format generated 59% of Google text ad clicks in December, up from 52 % in September. Google’s Affinity and Similar Audiences have become key text ad traffic drivers in the last two years, accounting for 13% and 20% of clicks in Q4 2021, respectively.
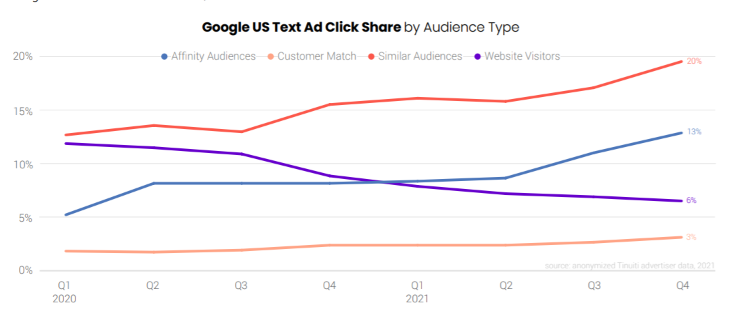
Customer Match has had a good share increase in the last two quarters, growing to 3.1% of text ad clicks in Q4 but still being a smaller share of overall traffic.
Google Shopping: Ad Clicks Increase, while CPC Growth Slows
In Q4 2021, Google Shopping ad spending increased by 37% year over year, with clicks up 19% and CPCs up 15%. Shopping CPCs are decelerating after spiking in early 2021 against weak comps, while Shopping clicks soared in early 2020 as consumers moved to eCommerce for more purchases.
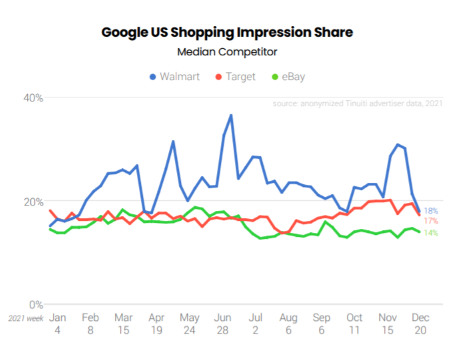
In early Q4 2021, Amazon, Target & Walmart’s Google shopping impression rose significantly. Target & eBay were neck and neck in terms of Shopping impressions, but this gap narrowed in the second half of the year and did not close over the holiday season.
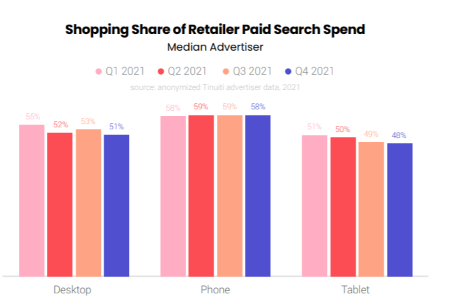
In Q4 2021, desktops accounted for little under 21% of Google Shopping clicks & tablets accounted for little under 3% of all Google Shopping clicks. With more people travelling for the holidays, the percentage of Google Shopping clicks from phones grew from 74% in Q4 2020 to 77% in Q4 2021.
YouTube, Discovery & Display: Ad Spend Inceased & Average CPM Growth decreased
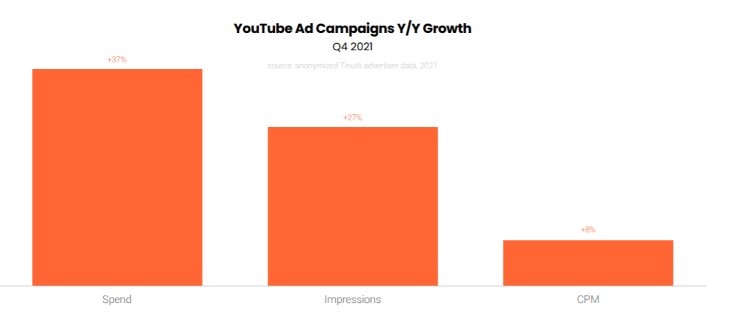
Advertiser expenditure on YouTube advertisements increased by 37 % year over year in Q4 2021. In Q4, YouTube ad impressions increased by 27%, compared to 26% in Q3, while the average YouTube CPM increased by 8%, compared to 14% in Q3. While year-over-year ad pricing growth is slowing across channels due to stronger year-ago comps, YouTube CPMs are being dragged down by a growing percentage of impressions on TV screens, where CPMs have been lower to date.
Desktop produced 18% of Discovery ad spend in Q4 2021, up from 15% a year earlier. Phones & Tablets generated 80% and 3% of Discovery campaign spend in the quarter respectively. After Apple’s new privacy measures rollout, CPMs for iOS devices on platforms like Facebook had a clear impact in Q4 2021. After decreasing in comparison to Android in Q1 and Q2 2020, the relative CPM for iOS devices was back to Q1 2020 levels.
Once again, to view the full Google Ads benchmark report, download it here.
Related Links


Stop the wasted ad spend. Get more conversions from the same ad budget.
Our customers save over $16 Million per year on Google and Amazon Ads.