In the third quarter of 2022, Tinuiti, a US-based digital marketing firm, published the Google Ads Benchmark Report. Based on anonymized Google programme performance data, the following are some of the study’s key findings.
The complete report can be downloaded here.
Slow CPC Growth For Retail & Non-Retail Advertisers Compared To Q2
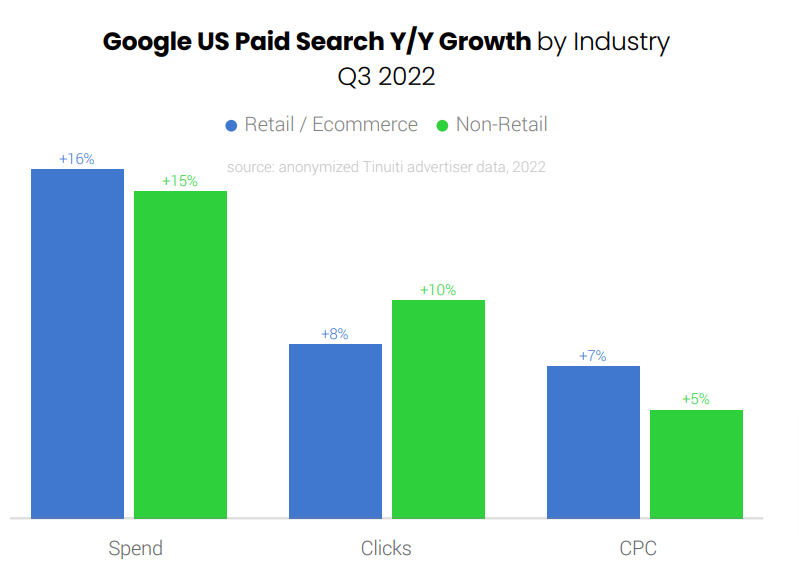
Spending on Google search ads slips to 15% Y/Y as CPC increases slowly. Google click growth increased to 9% Y/Y between Q2 and Q3 2022, while CPC growth slowed for the fifth consecutive quarter, reaching 6% Y/Y in Q2.
Between Q2 and Q3 2022, retail click growth decreased by merely one point, but CPC growth fell from 10% Y/Y in Q2 to 7% in Q3. Google search spending growth outside of retail remained constant at 15% Y/Y between Q2 & Q3. Growth in Q2 was predominantly fueled by higher prices, while Q3 spending growth was primarily led by a rebound in non-retailers volume growth.
During the initial Omicron rise in late 2021 and early 2022, clicks to get location details decreased by as much as 95% in April 2020 and were only marginally stronger. However during Q3 2022, get Location Details clicks, which are mostly produced by Google Maps, increased by 39% on average.
With regards to the click share for devices, mobile devices generated little more than 79% of retailers’ Google search ad clicks in Q3 2022, with phone click share increasing to 77% and tablet click share remaining just around 2%.
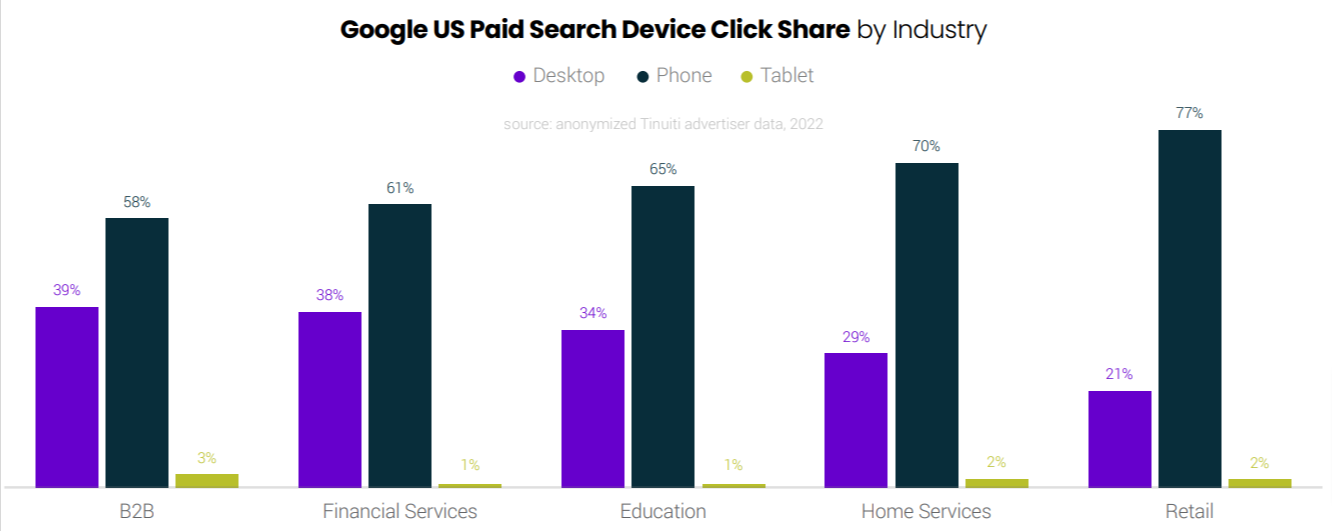
Home services achieved 72% clicks from phones and tablets. Even the B2B industry saw mobile devices account for 61% of Google search ad clicks in Q3.
Google Text Ads Spending Increased 13% While CPC Growth Slowed
Though spending on Google text ads rose 13% Y/Y, for Tinuiti’s clients, the current growth rate was just above that pre-pandemic level which was only 12%. Text ad CPC growth has also slowed down, reaching 7% Y/Y in Q3 2022. Text ad click growth was 6% Y/Y in Q3 2022, up from zero growth in Q2.
In February 2021, RSAs has become Google’s default ad format and at the end of June 2022, advertisers could no longer create or edit ETAs. As the phase-out of ETAs continues, Responsive search ad share has reached 83%.
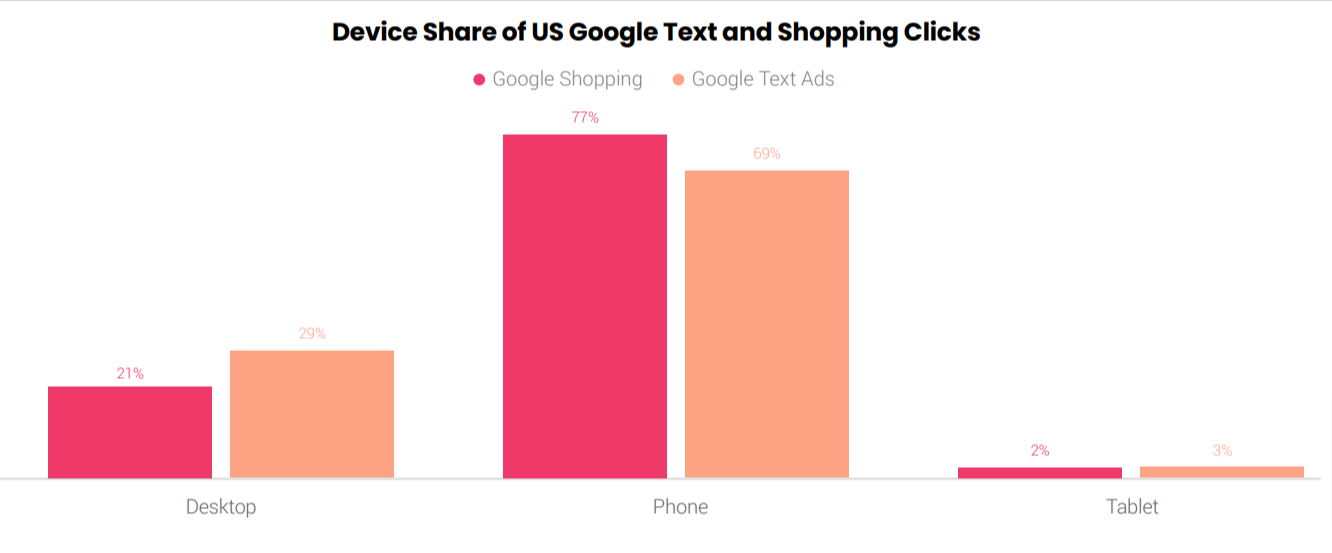
If we talk about text ad clicks for devices, mobile devices drove 72% of Google text ad clicks and 79% of Google shopping. For Google shopping ads in Q3 2022, 77% of clicks came from phones, 2% came from tablets, and 21% came from desktops and laptops.
The greatest portion of Google’s audience targeting segments—in-market and affinity audiences—each generated 17% of text ad clicks in Q3 2022.
Brisk Move From Smart Shopping to Performance Max Campaigns
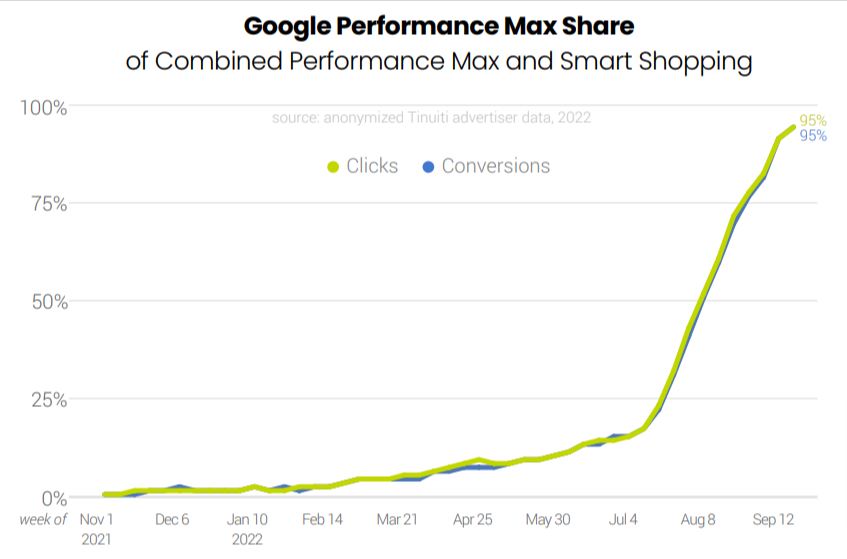
By mid-August, roughly half of the brands running Performance Max or Smart Shopping campaigns had fully switched over, and by the end of August, two-thirds had done so.
Up until this point, the Performance Max efforts have produced outcomes that strongly resemble those of the Smart Shopping initiatives. If Performance Max is utilizing significant amounts of new inventory, its click-through and conversion rates must be very comparable to those previously attained by Smart Shopping.
During the prime day event, Amazon’s percentage of Google Shopping impressions reached a high of 29 weeks, almost surpassing the level it reached towards the end of 2021. With regards to Walmart, Target, and eBay, each finished the third quarter with a comparable shopping presence to the previous year.
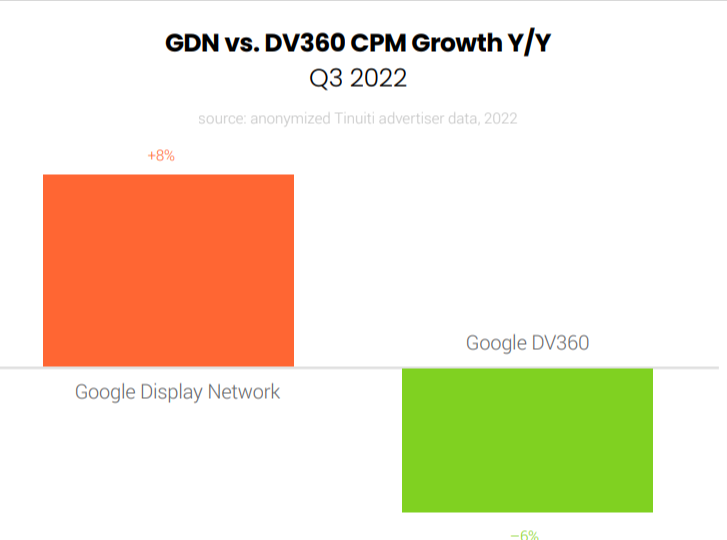
Slow CPM Growth Across The Google Display Network And DV360 Platforms
While DV360 CPMs decreased 6% in Q3 compared to Q2, GDN CPMs increased 8% Y/Y in Q3, down from 15% growth in Q2. In Q3, slower pricing growth was common across Google ad platforms, while YouTube and search advertisements both experienced a slowdown.
Spending on YouTube ads was up 19% Y/Y in Q3. According to Tinuiti, YouTube impression growth jumped from 29% year over year in Q2 to 56% year over year in Q3, yet CPM declines increased from a 9% decline in Q2 to a 24% decline in Q3.
CTV’s share of YouTube spend increased from 13% in Q3. Phone share of YouTube spending ticked down under 49%. The majority of CTV’s spend share gains have occurred at the expense of desktops, which contributed 32% of YouTube spending in Q3 2021 but only 22% in Q3 2022.
Once again, to view the full Google Ads benchmark report, download it here.
Related Links


Stop the wasted ad spend. Get more conversions from the same ad budget.
Our customers save over $16 Million per year on Google and Amazon Ads.