The Google Ads Benchmark Report for Q2, 2022 was released by Tinuiti, a digital marketing company based in the US. The following are some of the study’s main conclusions based on anonymized Google program performance data.
The complete report can be downloaded here.
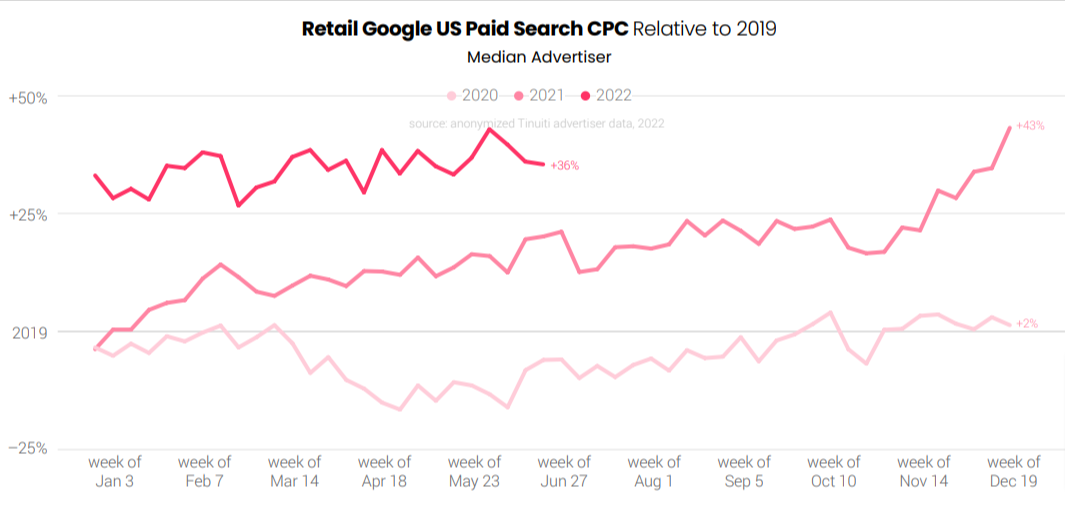
Retailer Google Search CPCs Stabilized Compared To 2019 Levels
Retailer CPCs experienced a significant decline in late Q1 2020, and it took the remaining year for them to return to 2019 levels. Over the course of 2021, CPCs increased dramatically and ended up at a level that was more than 40% higher than 2019 levels.
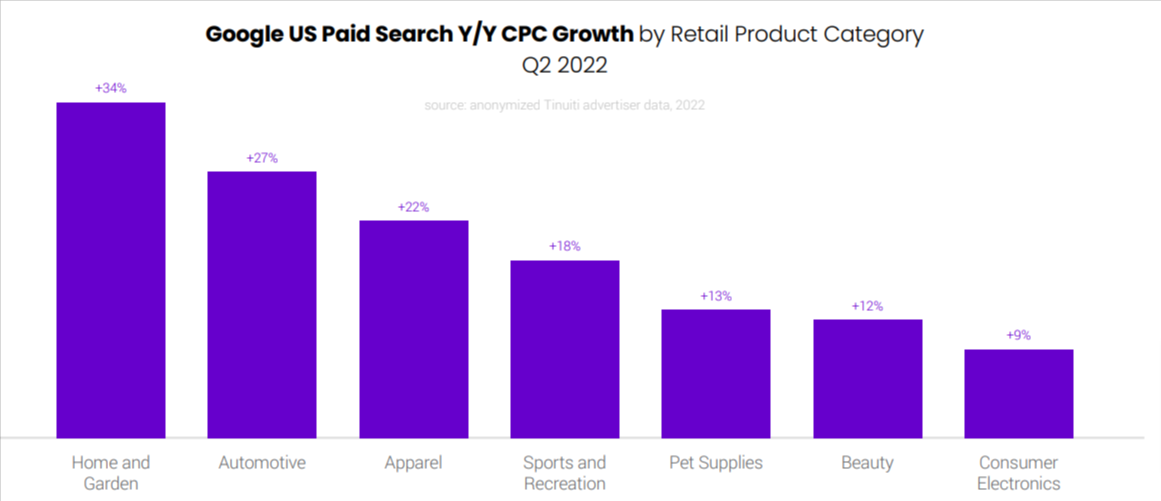
The average Google search ad CPC for home and garden advertisers increased 34% year over year in Q2 2022, the highest growth rate among the product categories examined for this research. Consumer electronics brands showed the smallest growth in CPCs, up just 9% year over year. Beauty CPC growth has significantly decreased, reaching just 12 % in Q2 2022 after increasing by 47% in Q4 2021.
While spending on Google text ads increased, Google Maps ad traffic information about physical business locations increased by 54% as customers continued to return to traditional brick-and-mortar stores.
In Q2 2022, Phones produced 76% of Google search ad clicks for retailers. In the B2B sector, desktops and laptops generate 44% of its Google search ad clicks and Tablet share of Google clicks was 3% or less across all industries in Q2.
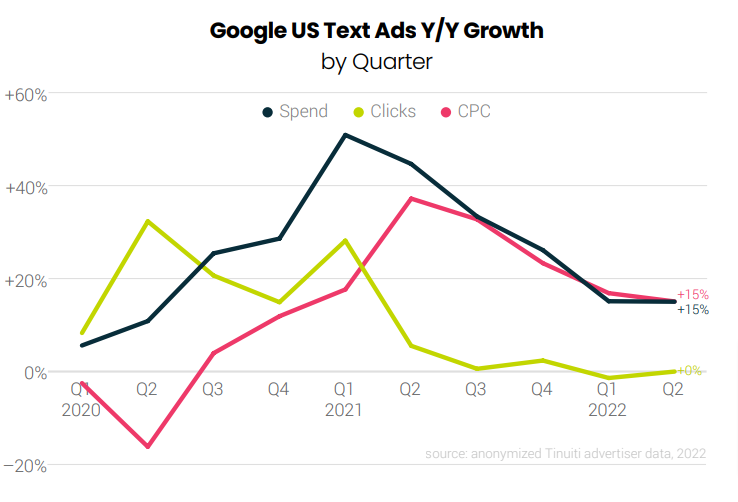
Google Text Ad CPCs Were Up By 15% Compared To Q2 2021
In Q2 2022, spending on text ads on Google increased by 15%. Since the middle of 2021, text ad click growth has been flat with rising CPCs and it was true in Q2, 2022 as well as CPC increased by 15%.
As Google retires Expanded Text Ads, the proportion of text ad clicks generated by its Responsive Search Ad format reached 71% in June 2022, up from 59% at the end of 2021.
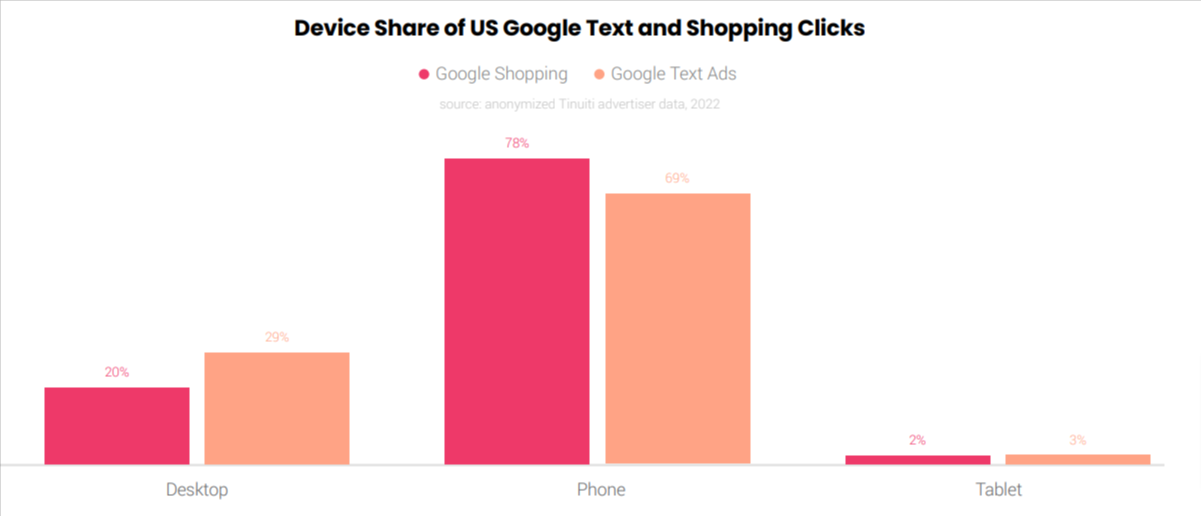
With regards to devices, phones produced 69% of Google text ad clicks in Q2 2022 and 78% of Google Shopping ad clicks. Desktops and laptops produced 29% of text ad clicks in Q2 2022, while tablets generated another 3%.
At the beginning of 2021, the affinity audience click share was just 8%, but by the middle of the year, it had started to soar. In Q2 2022, the Affinity audience targeting segment accounted for 15% of text ad clicks, almost equal to the percentage for Google’s In-market and Similar audience segments.
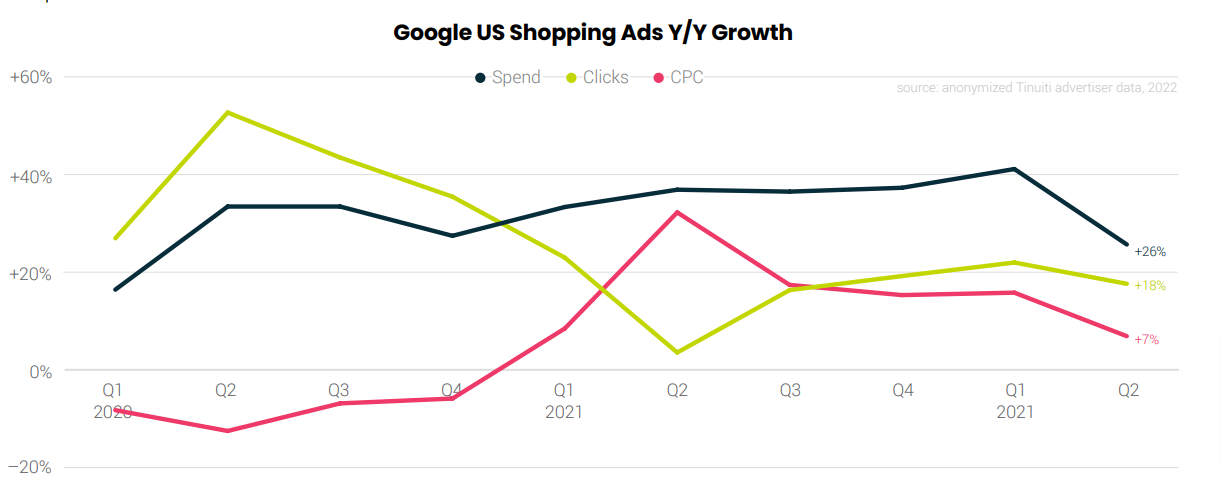
Google Shopping CPC Growth Fell At 7% Compared To 16% in Q1
In Q2 2022, spending on Google Shopping ads increased by 26% year over year. Shopping expenditures continue to expand at a quicker rate than they did in the second half of 2019 despite the fact that the rate was down from 41% a quarter earlier. Clicks on shopping ads increased 18% year over year in Q2 2022. However, shopping CPC growth declined more dramatically, down to 7% Y/Y from 16% in Q1.
While in Google Shopping auctions, Amazon seems to be acting more assertively. Other major firms in the retail sector observed a decline in shopping impressions. Target’s share of impressions experienced a modest decline. Also, Walmart’s share of shopping impressions had significantly decreased year over year.
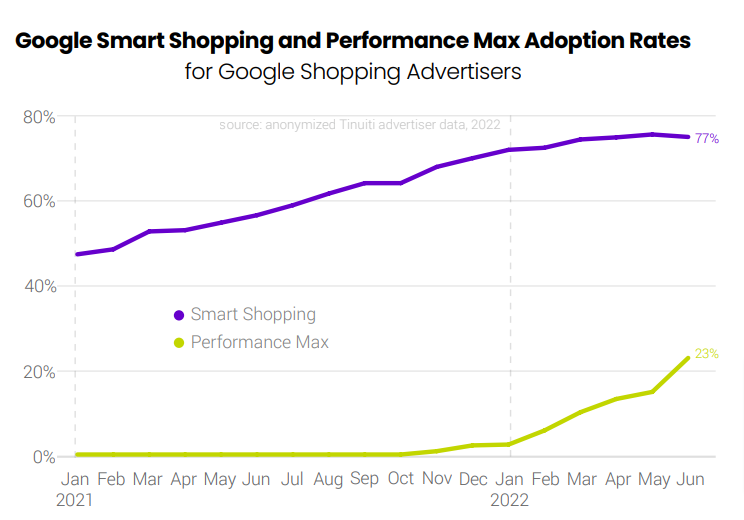
In June 2022, 76% of the brands using Google Shopping ads used Smart Shopping campaigns as part of their Shopping ad mix, while 23% used Performance Max. 77 % of the brands who are currently conducting Performance Max campaigns see the benefit in continuing to do so.
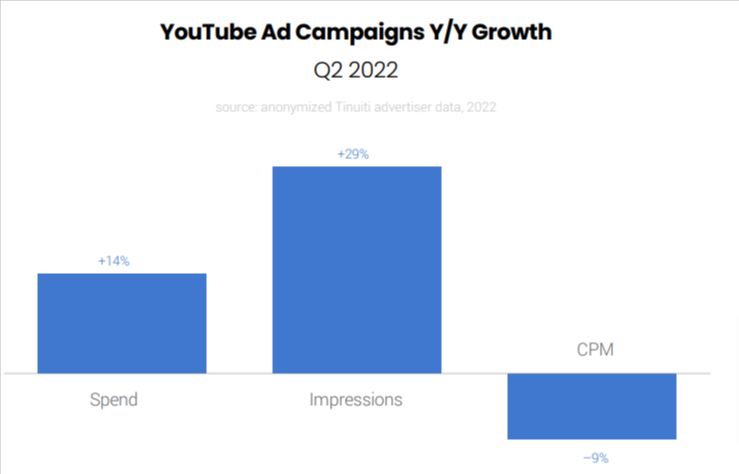
YouTube Ad Impressions Rose By 29% & GDN Saw CPM Rise By 15%
Advertiser spending on YouTube was up 14% Y/Y in Q2 2022. The average CPM for YouTube ads fell for the first time since the first quarter of 2021, coming in 9% lower Y/Y in Q2 2022. YouTube ad impressions were up 29% Y/Y.
The Google Display Network (GDN) saw an average CPM rise of 15% Y/Y in Q2 2022, a significant deceleration from 28% growth in Q1. Google Discovery campaigns generated 82% of their spend across phones and tablets in Q2 2022.
Connected TV (CTV), which made up 22% of YouTube ad spending in Q2 2022, has been one of the best-performing sectors on YouTube over the past year. The amount spent on YouTube ads for tablets was lower than last year, which caused the tablet spend share to decline by three points.
Once again, to view the full Google Ads benchmark report, download it here.
Related Links


Stop the wasted ad spend. Get more conversions from the same ad budget.
Our customers save over $16 Million per year on Google and Amazon Ads.