Tinuiti, a US-based digital marketing agency, shared the Amazon Ads Benchmark Report for Q1, 2022. Here are some of the study’s significant conclusions, which are based on anonymized performance data from Amazon programs under Tinuiti management.
The complete report can be downloaded here.
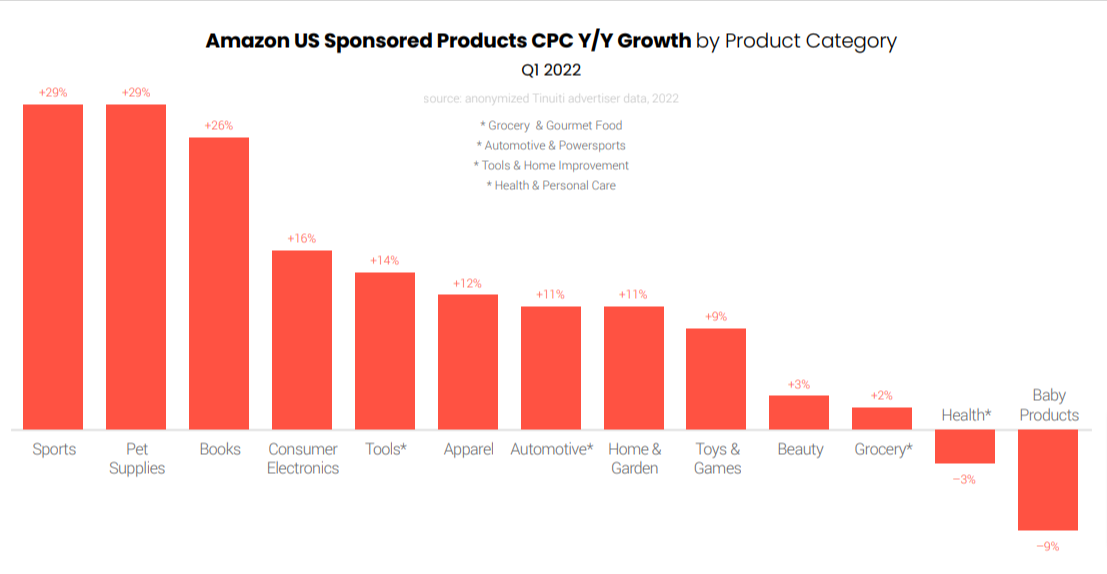
CPC Growth: Slow for Sponsored Products But Strong for Most Product Groups
Sponsored Products CPC growth fell in January to 19% before stabilizing at 14% in February and March. In December 2021, the CPC for Sponsored Products increased by 34% Y/Y, as advertisers were able to be more competitive throughout the month than they were in December 2020, when shipping issues led to earlier than usual holiday delivery cutoffs.
While the growth of Sponsored Products CPCs has slowed for many brands, the great majority of advertisers across product categories have seen Y/Y increases. Advertisers in sports, pet products, and books led the way in Q1 with year-over-year increases of more than 20%. Advertisers of health, personal care, and baby items, on the other hand, reported year-over-year declines in the quarter.
Amazon Sponsored Products sales revenue climbed faster year over year for the first time since Q4 2020. In the first quarter of this year, cost-per-click growth decreased to 15%, compared to 23% in Q4 2021.
For the past few years, Sponsored Brands spend growth has surpassed that of Sponsored Products, but that changed in Q1 2022 when Sponsored Brands spend growth slowed to 8%, slightly less than 9% for Sponsored Products. CPC growth slowed in the first quarter, growing 3% year over year compared to 8% in the previous quarter.
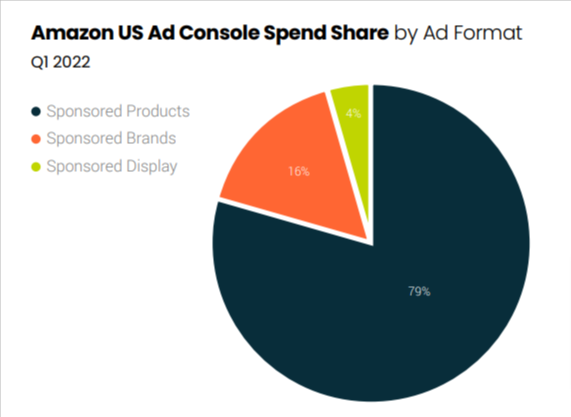
In Q1 2021, Sponsored Display campaigns accounted for only 2% of Amazon Ad Console spend, but this increased to 4% in Q1 2022. Sponsored Brands accounted for 16% of Ad Console spend in Q1, while Sponsored Products continued to account for the great bulk of ad investment (79%) in Q1.
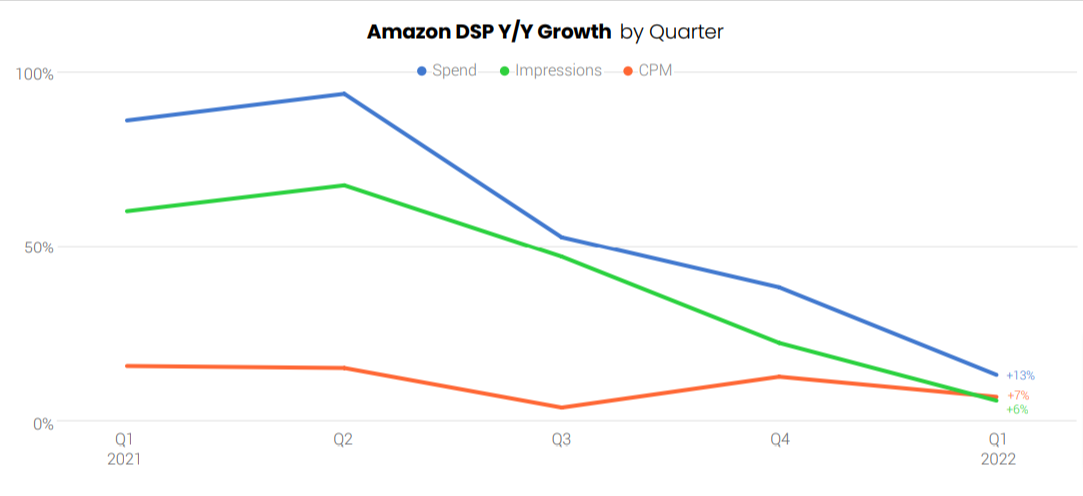
Amazon DSP: Spend Growth Continued to Surpass Sponsored Products & Sponsored Brands
Advertisers remarkably increased DSP spending in the last Q1, when investment rose 87% Y/Y. Impressions increased 6% Y/Y, while CPM increased 7%, despite the fact that CPM is significantly influenced by changes in ad formats and inventory advertisers target over time.
Many DSP advertisers are now using Amazon’s Responsive eCommerce Creative (REC), which represented 63% of all expenditure in Q1 2022. In late 2020, Amazon released an update that allowed brands to use third-party audiences with much ease in Amazon DSP targeting. This has resulted in a large increase in the share of spend coming from campaigns that aren’t targeting Amazon audiences.
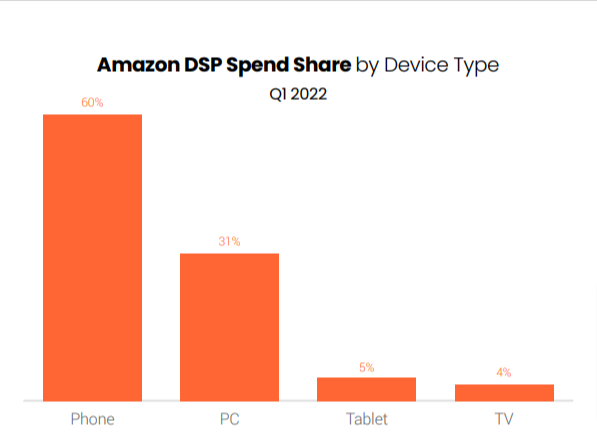
In Q1 2022, 60% of all Amazon DSP spending went to phones. Tablets accounted for 5% of spend, while 4% of spend went to televisions.
Walmart Advertising: Manual Campaigns Contributed to Majority of Walmart Sponsored Products Spend
For the first time, the share of total Walmart Sponsored Products spend attributed to manual campaigns topped 50% in Q1 2022. Walmart initially limited the placements available through manual campaigns, however the inventory available through manual campaigns has increasingly grown.
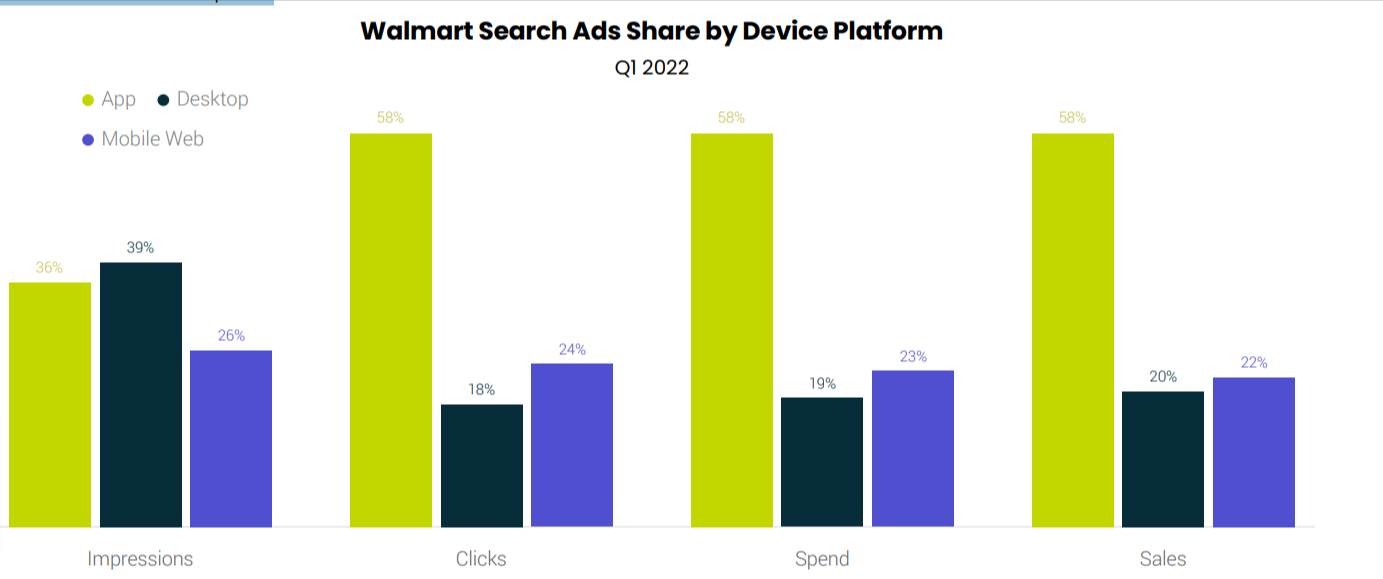
In terms of clicks, spend, and sales for sponsored products and Search Brand Amplifier campaigns, the Walmart App has outperformed mobile and desktop. Walmart app accounted for 58% of all clicks, sales, and spend in Q1 2022; however, the mobile web and desktop saw their proportion of these three metrics fall from Q4 to Q1, as the app has become the preferred ad placement for many advertisers. Over 80% of Walmart search ad expenditure is spent on the app and mobile web combined.
Search Brand Amplifier (SBA) ad units are quickly becoming a major element of how Walmart marketers reach customers as the share of total Walmart search spend attributed to them doubled from 7% in Q4 to 14% in Q1.
Once again, to get the complete Amazon Ads Benchmark report, download it here.
Related Links


Stop the wasted ad spend. Get more conversions from the same ad budget.
Our customers save over $16 Million per year on Google and Amazon Ads.