Tinuiti, a US-based digital marketing agency, shared the Google Ads Benchmark Report for Q1, 2022. This report gives insights across paid search, Shopping, YouTube, and Discovery. As we are slowly coming out of the pandemic, CPCs for Google search ads and brand keywords have shown a sharp increase. Clicks and total spending on shopping ads have also increased. Here are some of the key findings from the report.
The complete report can be downloaded here.
Google Search Ad CPCs for Most Retailers is Sharply Up in 2022
In Q1 2022, the average retailer paid almost 30% more per Google search ad click than in Q1 2019. During the pandemic, retail CPCs dropped despite surging online demand. By the end of 2020, Google CPCs had recovered their 2019 levels and were trending higher during 2021.
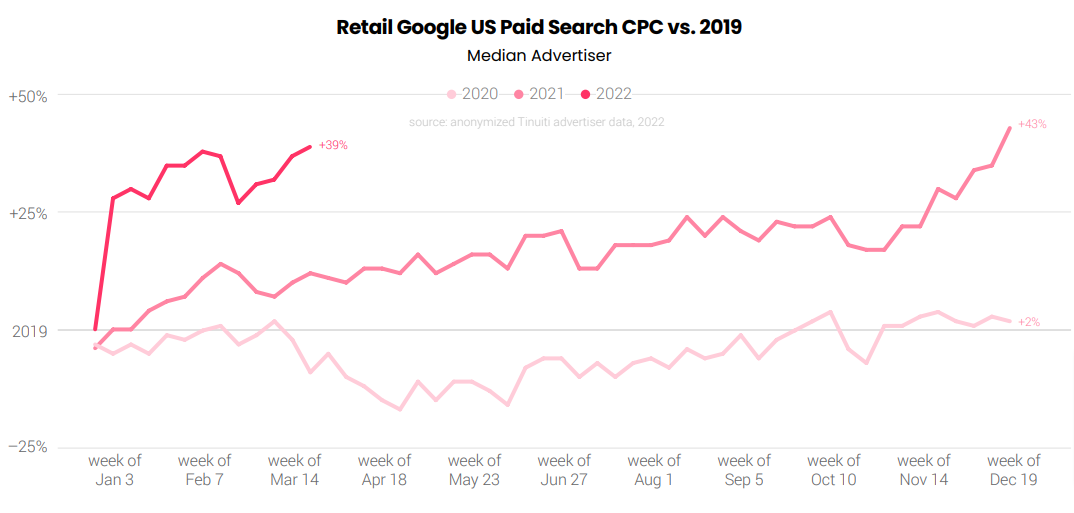
In Q1 2022, pet supply retailers experienced the largest Google search CPC rise of 34 %. However, CPC growth slowed in almost all product categories. Beauty stores witnessed the sharpest slowdown, with CPC growth dropping from 47 % in Q4 to 30 % in Q1.
Consumer interest in physical retail locations increased the most in 2019 compared to the start of the pandemic. Clicks on Google Get Location Details links were up 19% in March compared to the same month last year.
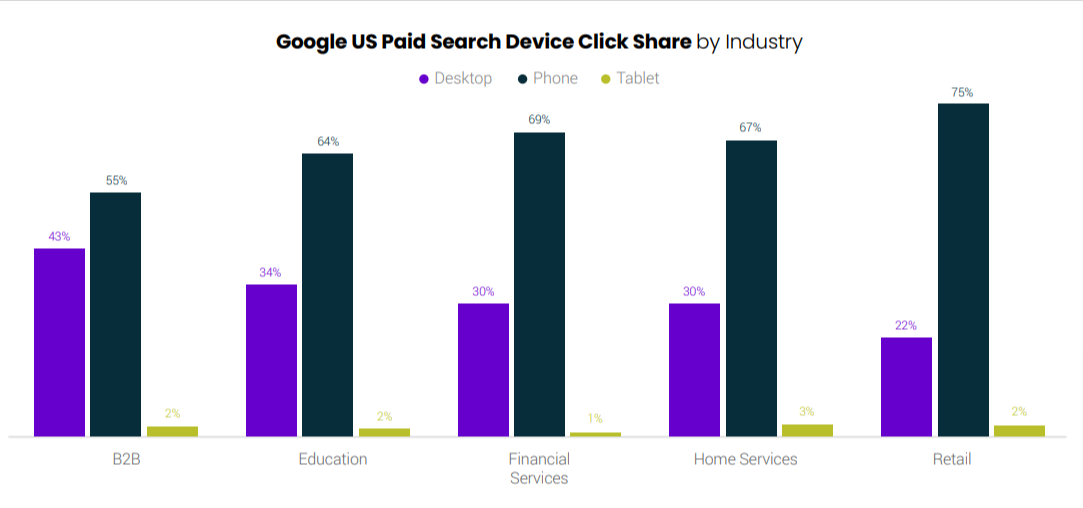
In Q1 2022, phones generated the greatest percentage of Google search ad clicks once again in retail. Phones accounted for 75% of retail ad clicks in Q1, while desktops generated just 22% of retail clicks.
CPCs for Brand Keywords have Increased by 27% on Google
Advertisers using Google to run keywords for their own brand names saw their average CPC jump by 27% from Q1 2021 to Q1 2022. Over the same time period, non-brand CPCs also increased by 24%.
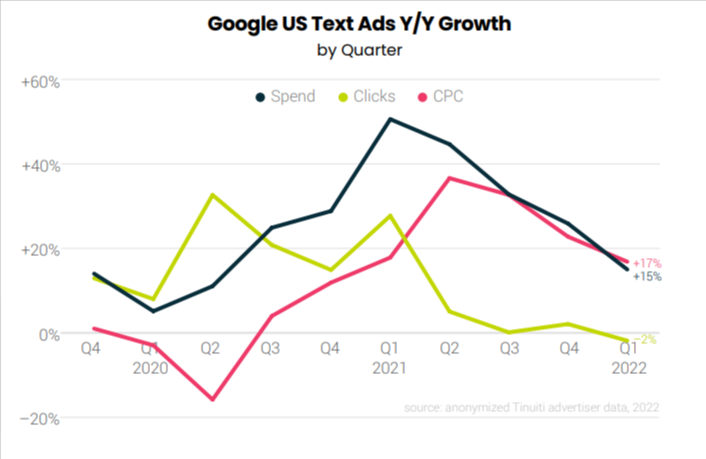
While spending on Google text ads increased 15% year over year in Q1 2022, clicks declined for the first time since mid-2019, falling 2% year over year. In Q1, the average CPC for Google text ads increased by 17 % year over year.
More than 60% of Google’s text ad clicks come from users in audience segments. In Q1 2022, Similar Audiences accounted for 18% of Google text ad clicks, down from 20% in Q4 2021 but still ahead of Affinity Audiences at 13%.
Google Shopping Listings Continue to Draw More Clicks and Ad Budgets
Google’s popularity as a shopping location among consumers remained strong in Q1 2022. In Q1 2022, clicks on Google Shopping ads increased by 22 % year over year, up from 19 percent in Q4. With an increase of 16 % in average CPC in Q1, total spending on Shopping ads increased by 41% year over year.
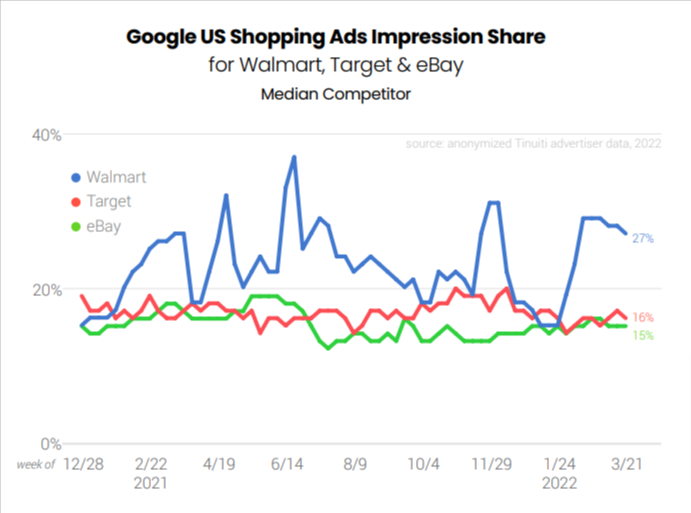
Post thanksgiving week, Walmart’s share of Google Shopping impressions spiked in February 2022 and remained elevated through March. In Q4, eBay did not see much of an increase in impression share, but in early 2022, it has seen a slight increase. Over the holidays, Target witnessed a smaller but more consistent increase in impression share.
With regards to devices, in the first quarter of 2022, phones accounted for 78 % of all Google Shopping clicks. Desktops accounted for 20% of Shopping clicks, with tablets accounting for the remaining 2%. Phone clicks are still significantly less expensive than desktop clicks, with desktops accounting for 35% of Google Shopping spending and phones accounting for 63%.
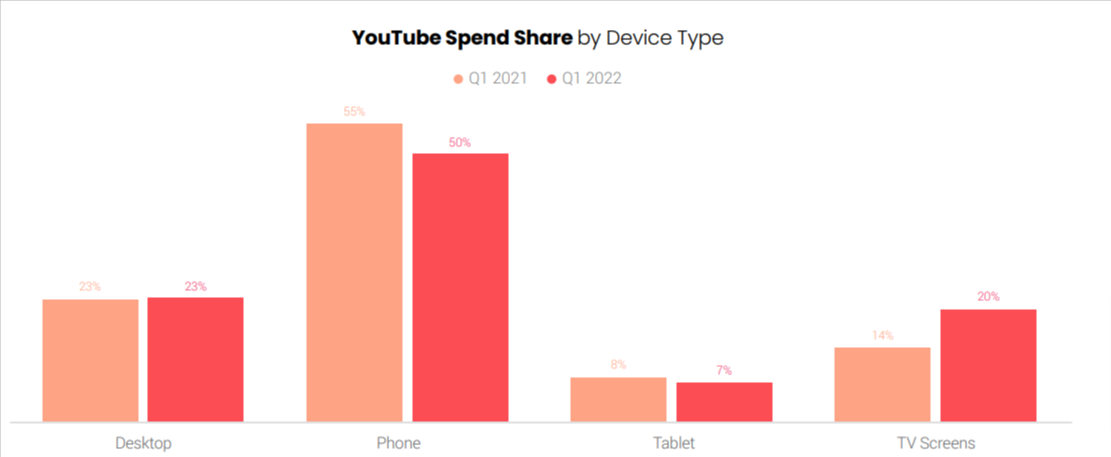
YouTube Ad Spend & Average CPMs for GDN was 28% Up
In Q1 2022, advertiser expenditure on YouTube placements increased by 28% year over year. Tinuiti advertisers saw a 23 % year-over-year increase in YouTube impressions in Q1 2022, and a % year-over-year increase in average CPM.
In Q1 2022, connected TV accounted for 20% of YouTube spend. Between Q1 2021 and Q1 2022, desktop share remained stable at 23%, while tablet share fell a point to 7%.
The average CPM for the Google Display Network (GDN) was up 28% Y/Y in Q1 2022. For placements made through Google DV360, the average CPM was up 19% Y/Y in Q1 2022. The GDN has witnessed some of the most significant price increases in recent quarters across Google’s various ad sectors, including search, display, and YouTube.
Once again, to view the full Google Ads benchmark report, download it here.
Related Links


Stop the wasted ad spend. Get more conversions from the same ad budget.
Our customers save over $16 Million per year on Google and Amazon Ads.