Google releases its financial result every quarter, giving us insight into how they have progressed. They used to share paid-click and cost-per-click information on Google Properties along with other results. As of late, they have discontinued sharing that data.
We have captured all the historical data and have prepared it graphically for a clearer understanding.
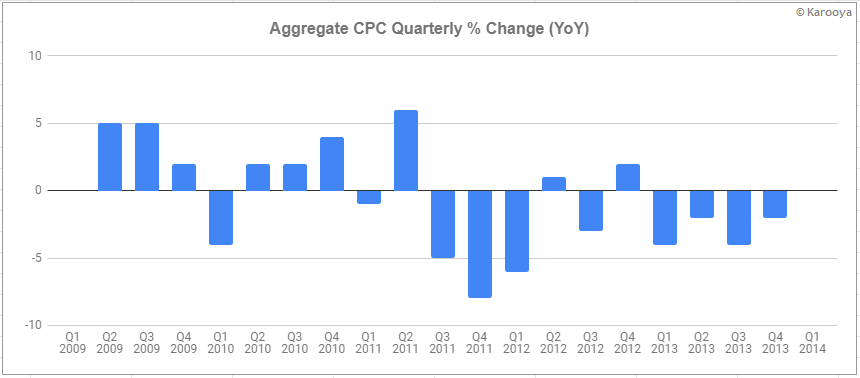
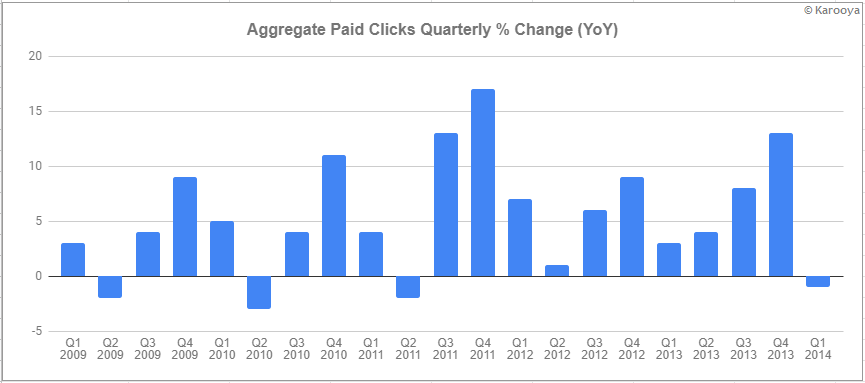
Previously Google captured the aggregate paid clicks and aggregate CPC data. From Q1, 2009 to Q1, 2014 we captured that data. Here are the details:
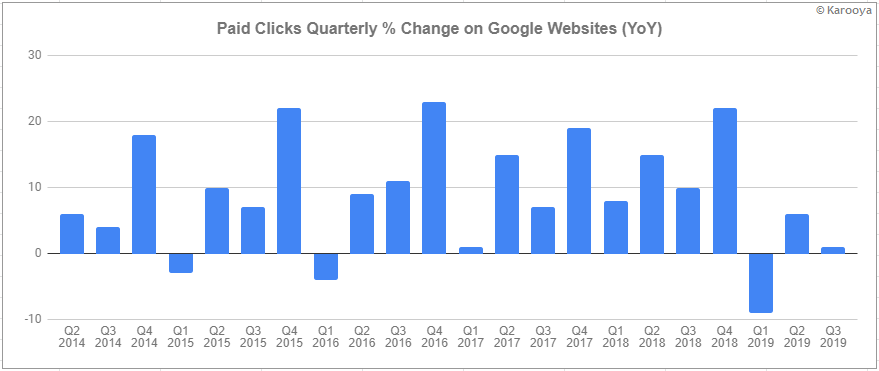
Thereafter they added paid clicks and CPC to their financial results. Here is the graphical representation of paid clicks on Google properties captured from Q2, 2014 till Q3, 2019.
This shows the % growth witnessed in a quarter compared from that of the same quarter in the previous year. Here are the details:
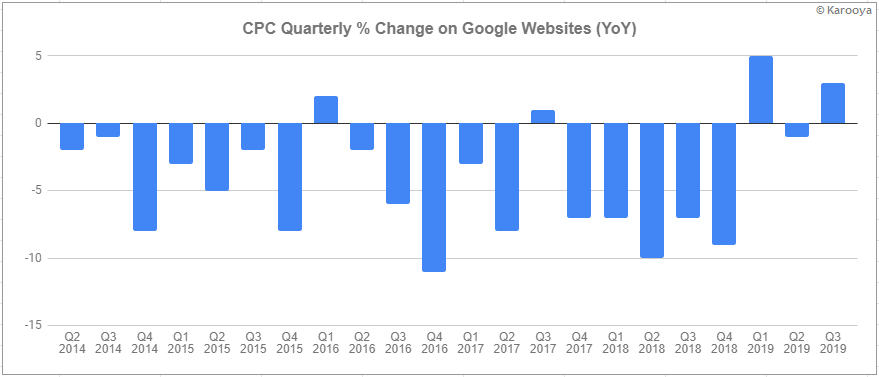
Here is the graphical representation of CPC on Google properties captured from Q2, 2014 till Q3, 2019
Data Source – Alphabet Investor Relations
Related Links:


Stop the wasted ad spend. Get more conversions from the same ad budget.
Our customers save over $16 Million per year on Google and Amazon Ads.