Merkle released its Digital Marketing Report for Quarter 2, 2020 this week. We have penned down some of the key findings from the report in this post.
The complete report can be downloaded here.
Due to the COVID-19 pandemic, the digital marketing saw a drastic change in Q2 2020. Many industries saw an intense change in online traffic and ad clicks across digital channels.
Positive Spend Growth Across Advertising Platforms & Devices
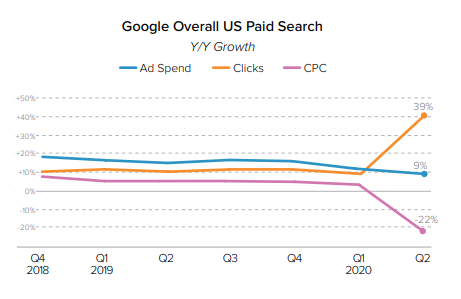
With consumers turning online for a larger share of economic activity in the wake of the pandemic, search ad click growth spiked to 38% Y/Y in Q2 2020. Spending on Google search ads rose a little less than 9% in Q2 2020, down from 11% growth in Q1.
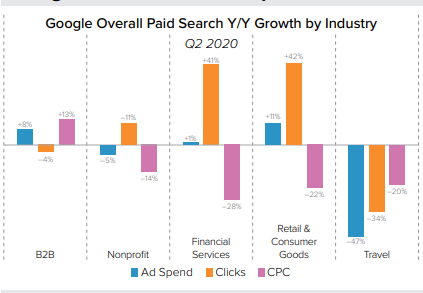
Both retail and financial services advertisers saw Google click growth of over 40% in Q2. Search ad spending by retail and consumer goods advertisers rose 11% Y/Y in Q2 2020, but CPCs were down more sharply for financial services, resulting in lower spend growth.
Device usage returned to its pre-pandemic standard by late April. Google search ad spending on phone traffic increased by 16% Y/Y and Desktop spending increased by 7% in Q2, up from 6% growth in Q1.
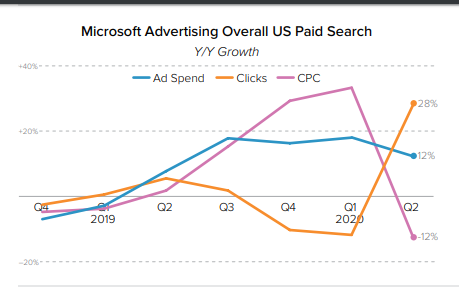
Microsoft saw a larger increase in phone click share than Google between Q1 and Q2, but phones still only accounted for 28% of Microsoft search ad clicks in Q2 2020, while desktop produced 66%.
Spending on Microsoft Search Ads & Text Ads increased by 12% and 13% respectively in Q2 2020. However, Microsoft Product Ad spending growth slowed from 23% Y/Y in Q1 to 11% Y/Y in Q2
Elevated Organic Search Traffic Across Retail & Financial Industries
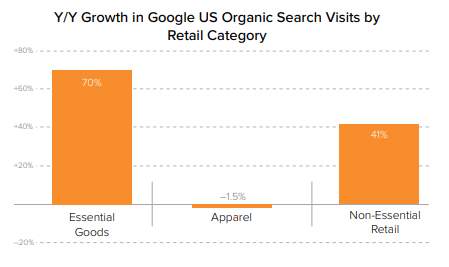
Organic search for essential retail including health and grocery items spiked by 70% before COVID-19 restrictions however, click growth slipped to 34% in the month of June.
Phones and tablets combined to produce 64% of Google organic search visits to brand sites in Q2 2020, up from 63% a year earlier. Consumers shifted some of their searches from mobile to desktop in the early days of the pandemic, that effect wore off pretty quickly in early Q2.
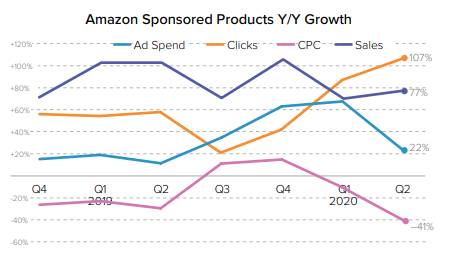
An Increase in Amazon Sponsored Products & Sponsored Brand Ad Spend
Spending on Amazon Sponsored Products ads rose 22% Y/Y in Q2 2020. however, click growth stimulated to 107% Y/Y. CPCs fell much more sharply, coming in 41% lower.
An increase of 58% has been seen in Sponsored Brands ad spending in Q2 2020. Due to Coronavirus Pandemic Amazon faced fulfilment difficulties and in addition to this many brands faced their own supply chain and inventory challenges in Q2. As a result, CPCs fell 19%.
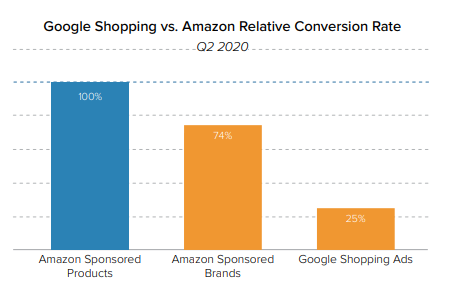
If we compare conversion rates between Google Shopping Ads and Amazon Ads, they were significantly lower. Google Shopping conversion rates were 25% of Sponsored Product conversion rates in Q2 2020, up from 20% in Q1.
Social Paid Platforms Experienced Boost in Impressions
All paid social media platforms saw a boom in ad spend and impressions. Spending on Facebook increased by 4% Y/Y in Q2 2020. Facebook ad impressions were up 25% Y/Y in Q2, while average CPM fell 17% Y/Y in Q2 2020, down from a 36% increase in Q1.
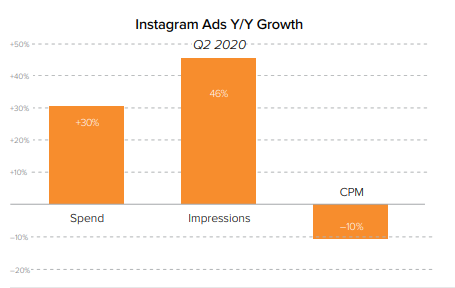
Spending on Instagram ads rose 30% Y/Y in Q2 2020 for brands active on the platform over the past year. Ad impressions rose 46%, but average CPM fell 10% Y/Y in Q2 2020.
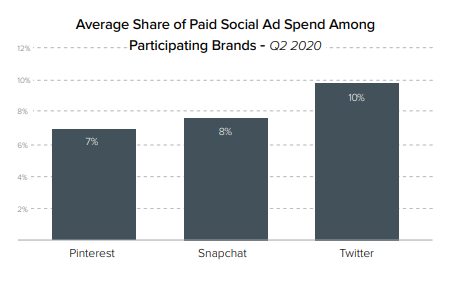
Although Snapchat, Twitter, and Pinterest do not enjoy the same widespread adoption as Facebook and Instagram, they often play a significant role for particular brands and industries. With regards to social media ad spend in Q2 2020, Pinterest, Snapchat, and Twitter generated 7%, 8%, and 10 % respectively.
Ad spending on traditional display ad platforms including DV360 and the Google Display Network fell 11% Y/Y in Q2 2020, down from 1% growth in Q1.
Once again, here is the link to download the report and access the findings.
Related Links
- Merkle | Q1 2020 Digital Marketing Report | Key Highlights
- Key Findings From The CMA Digital Advertising Report
- How Many Negative Keywords is Too Many?


Stop the wasted ad spend. Get more conversions from the same ad budget.
Our customers save over $16 Million per year on Google and Amazon Ads.