Merkle released its Digital Marketing Report for Quarter 1, 2020 this week. We have elaborated on some of the key findings from the report in this post.
You can download the complete report and access the findings here.
Solid Start to Quarter Sees Opposing Trends by End of March 2020
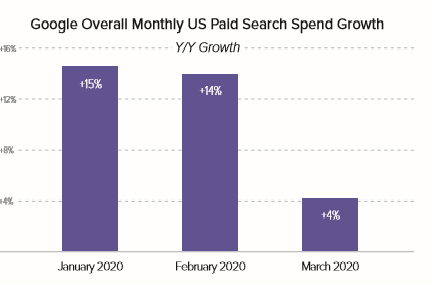
Google search ad spend grew 11% Y/Y in Q1 2020, down from 16% growth in Q4 2019. It is the weakest growth Merkle has seen over the eight years. Travel programs reduced budgets by nearly 80% on average compared to January. If we picture the impact that the COVID-19 pandemic had on Google search ad spending growth at the monthly level, Merkle saw an 11-point deceleration in Google spend growth between January and March.
 We also see a significant and immediate impact of COVID-19 on travel search budgets. By March 16th, travel spend was already down over 60% from January levels.
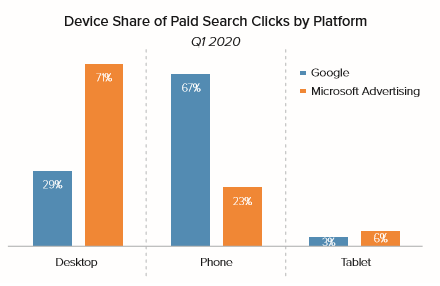
As consumers are spending more time at home on their laptops and desktops, the desktop share of Google search ad clicks is now running about four points higher. Spending growth for desktop Google search ads slowed to a little under 6% Y/Y. Phones continued to drive most spending gains for Google search ads in Q1, with spending up 26% Y/Y and tablet spending continued to decline sharply in Q1 2020, falling nearly 43%. Google and Microsoft saw opposing trends for device click share. Google clicks slipped to 29% in Q1 2020. Microsoft was roughly the reverse, with desktop gaining nearly four points of share between Q1 2019 and Q1 2020.
Though retail saw stronger digital ad growth than most other verticals, Amazon appeared to pull back on its Google text ad spending earlier and more severely than its Shopping ad spending. While Amazon ultimately shut down its Google Shopping program, its presence in Shopping auctions remained more robust into early March. Among retailers, Google Shopping ads generated 63% of Google search ad clicks in Q1 2020, up from Q4 2019 levels, but down from 65% share in Q1 2019.
Google Picks Up Organic Search Share Holding up Better Than Largest Competitors
As awareness of COVID-19 began rising sharply in mid-March, essential retailers like grocers and drugstores saw organic search grow 53% Y/Y for the week ending March 15th. For the same period, non-essential retailers like apparel and specialty merchandisers saw organic clicks fall 31% Y/Y.
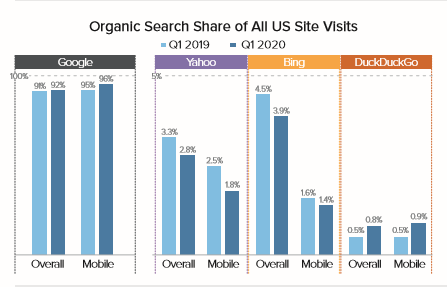
With Bing and Yahoo seeing larger declines in organic search visits, Google generated 96% of organic search visits in Q1 2020 on mobile devices.
Phones produced 52% of organic search visits in Q1 2020 and desktop share of organic search increased slightly in the past year, rising to 44% in Q1 2020. Tablet share of organic search visits fell 4% in Q1 2020.
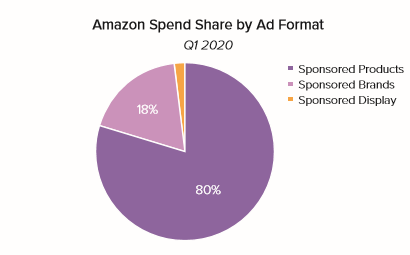
Amazon Sponsored Brands Spend Share Remains Elevated than Sponsored Products
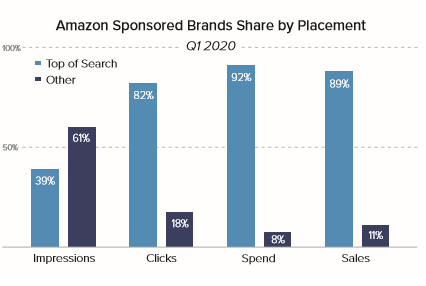
Amazon Sponsored Brands ads tend to see directionally similar long-term growth trends as Sponsored Products, but with wider swings. For the format formerly known as Headline Search Ads, top-of-search placements, top of search generated 89% of Sponsored Brands sales in Q1 2020 and 39% of impressions for the format.
While top-of-search placements only accounted for 3% of Sponsored Products ad impressions in Q1 2020, they generated 51% of sales for the format. Product details pages produced 85% of impressions for Sponsored Products but generated just 31% of sales.
Sponsored Products accounted for 80% of Amazon Sponsored Ads spend in Q1 2020, up from 79% in Q4 2019. Sponsored Brands generated 18% of spend in Q1, sustaining its share from Q4.
Gap Between Amazon and Google Ads Sales Per Click Widen. Average conversion rates for Amazon Sponsored Products were about five times higher than average conversion rates for Google Shopping ads in Q1 2020.
Spending Across All Social Media Platforms Gone Slightly Up
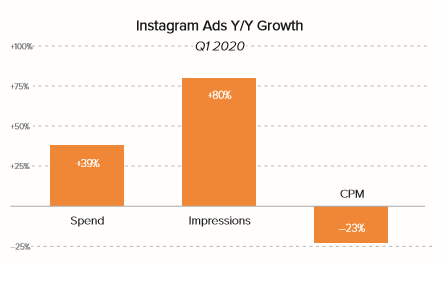
Spending on Facebook ads, excluding Instagram, grew 19% Y/Y in Q1 2020. Instagram spending growth was steady. Advertiser spending on Instagram grew 39% which was slightly up from 38% growth in Q4 2019 but impressions rose 80% Y/Y.
In Q1 2020, mobile devices continue to drive nearly all Facebook click volume. It produced over 95% of Facebook ad clicks. Spending on YouTube ads grew 19% Y/Y in Q1 2020, down from 43% growth in Q4 2019 as some brands paused their campaigns.
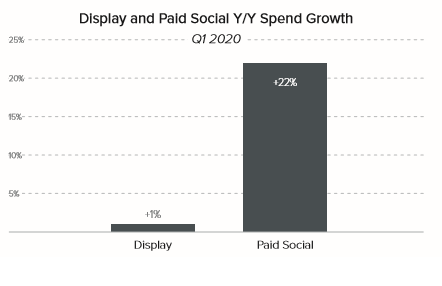
Spending across all social media platforms, including Facebook and Instagram, as well as Pinterest, Snapchat, and Twitter grew 22% Y/Y. In Q4 2019, paid social ad spend increased by 21%.
Once again, here is the link to the downloadable report.
Related Links
- Merkle | Q4 2019 Digital Marketing Report | Key Highlights
- Merkle | Q3 2019 Digital Marketing Report | Key Highlights
- How to Cut PPC Cost During Uncertain Times


Stop the wasted ad spend. Get more conversions from the same ad budget.
Our customers save over $16 Million per year on Google and Amazon Ads.