Tinuiti, a U.S.-based digital marketing agency, has released the Q1 2024 Digital Ads Benchmark Report, which provides key insights into the latest trends across Google, Meta, Amazon, and other platforms. This report is based on anonymized performance data from Tinuiti’s managed advertising programs and highlights several significant findings.
The complete report can be downloaded here.
Decoding the Performances of Major Digital Ad Platforms in Q1 2024
Spending growth of Amazon Sponsored Products, Facebook, Google Search and YouTube was steady from Q4 2023 to Q1 2024 but Instagram was an exception.
Over the last two quarters, Amazon Sponsored Products mirrored the 17% Y/Y growth trend of Google Search and YouTube. This consistency highlights the dominance of Sponsored Products within the Amazon Ad Console, accounting for 82% of spending in Q1.
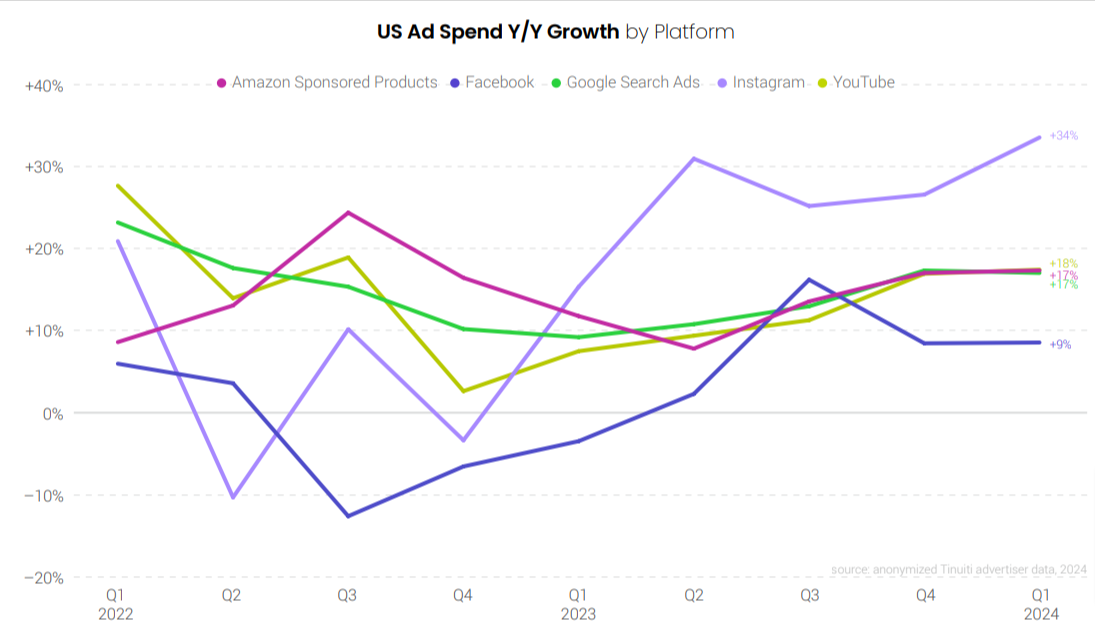
Instagram steals the show! While spending on other major platforms remained consistent, Instagram surged ahead with a whopping 34% Y/Y growth in Q1, marking its fifth consecutive quarter of leading the pack.
Instagram’s Share of Meta Advertising Spend Increased, Yet Facebook Leads
Instagram gained ground in Meta’s advertising revenue, increasing its share from 27% to 30% in Q1 2024, while Facebook’s share dipped slightly to 69%.
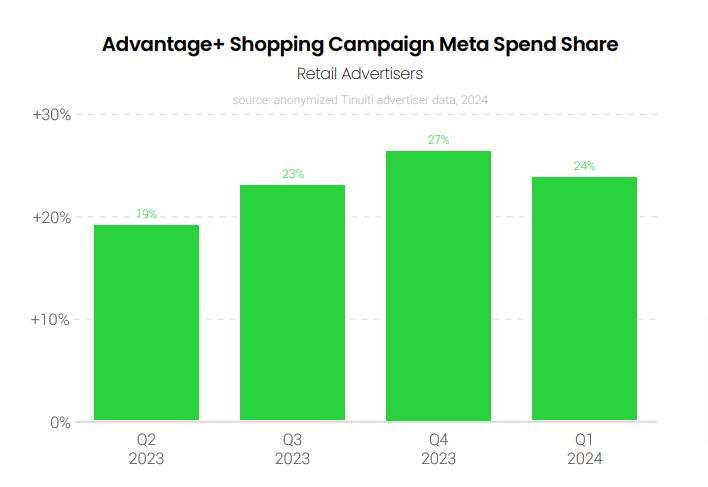
Advantage+ Shopping accounted for 24% of Meta’s retail ad spend in the first quarter. This campaign type has grown over the past year, rising from 19% of retailer spend in the second quarter of 2023.
Reels video ads for Instagram and Facebook improved. The proportion of Instagram impressions coming from Reels video ads remained steady at about 11% from the first quarter of 2023 through the fourth quarter, but it climbed to 13% in the first quarter of 2024, marking an all-time high for Tinuiti advertisers. On Facebook, 7% of total ad impressions were from Reels video ads, while 10% came from Reels overlay units.
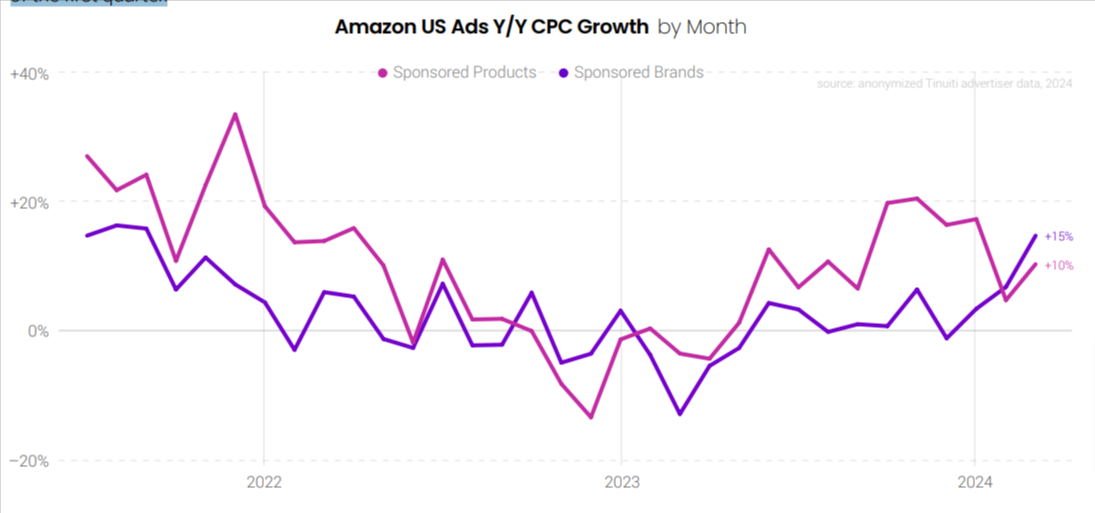
Amazon Sponsored Brands & Products See CPCs Surge Over 10% in March
In March 2024, for the first time since November 2021, cost-per-click (CPC) for both Amazon Sponsored Products and Sponsored Brands increased by at least 10% year over year in the same month. Although CPC growth for Sponsored Products slowed from 17% in January to 10% in March, the growth for Sponsored Brands accelerated from 3% in January to 15% in March.
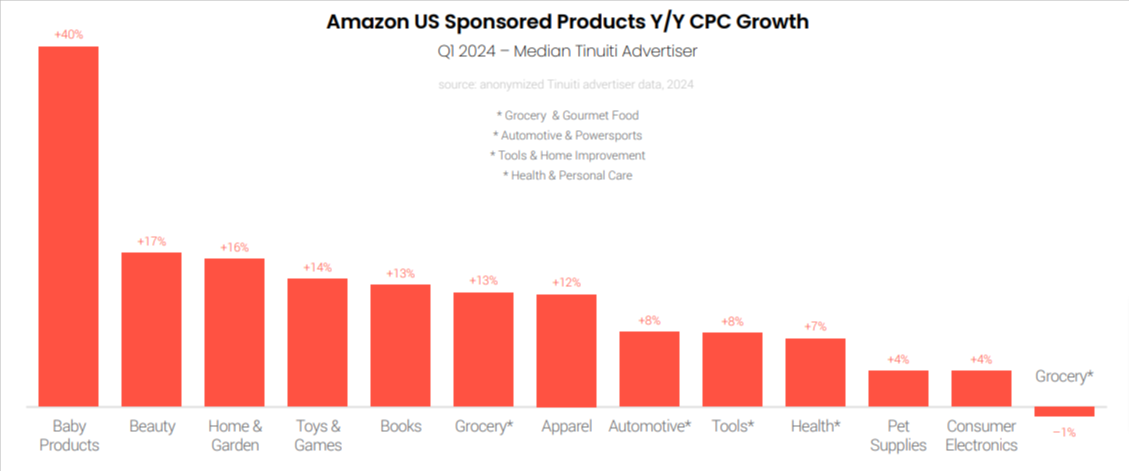
Amazon Sponsored Products cost-per-click (CPC) is going up in most product categories. In the first quarter of 2024, the median advertiser in twelve out of thirteen categories studied for this report experienced CPC growth. Baby products had the largest CPC jump, with a 40% increase compared to last year, while sports products were the only category where CPC decreased.
Similar to Amazon Sponsored Products, the cost-per-click (CPC) for Walmart Sponsored Products has increased by at least 25% for ten consecutive months. Advertisers boosted their spending on Walmart Sponsored Products by 35% year-over-year in the first quarter of 2024, with clicks rising by 3% and CPC climbing by 31% during the quarter.
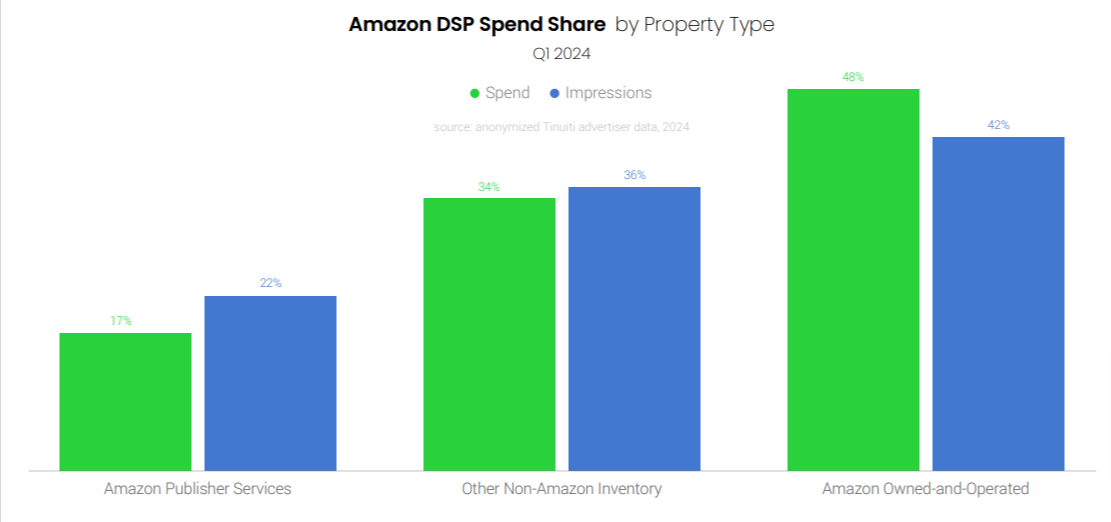
Amazon DSP Soars: Ad Spending Up 18% in Q1 2024
Brands that use Amazon’s demand-side platform (DSP) increased their spending by 18% year-over-year in the first quarter of 2024. However, this represents a slowdown compared to the 33% growth seen in the fourth quarter. Impressions have shown particularly strong growth in recent quarters, reaching 65% year-over-year in the first quarter after a 49% increase in the fourth quarter.
The share of total Amazon DSP investment attributed to Amazon owned-and-operated (O&O) sites, including the Amazon website and app, slipped from 53% in Q4 to 48% in Q1.
Although phones continue to account for over half of Amazon DSP spending, connected TV has been gaining ground in recent years, representing 11% of spending in the first quarter of 2024. Both phones and desktops experienced a decrease in spend share from the fourth quarter to the first quarter, coinciding with the growth in TV’s share of the budget.
Click here to get the complete Digital Ads Benchmark Report.
Related Links


Stop the wasted ad spend. Get more conversions from the same ad budget.
Our customers save over $16 Million per year on Google and Amazon Ads.