Tinuiti, a US-based digital marketing agency, shared the Google Ads Benchmark Report for Q3, 2020. Q3 was quite different from Q2 for many advertisers in terms of new changes in the Google Ads platform, Smart shopping & more. Here are some of the key findings from the report.
The complete report can be downloaded here.
Search Term Report Update & Close Variants: Obstructs Dependency to Find Poor Matches
Tinuiti advertisers spend millions on Google search ads per month and because of this announcement from Google, from August to September, there was a significant drop in the share of spend attributed to search queries across ad formats and device types.
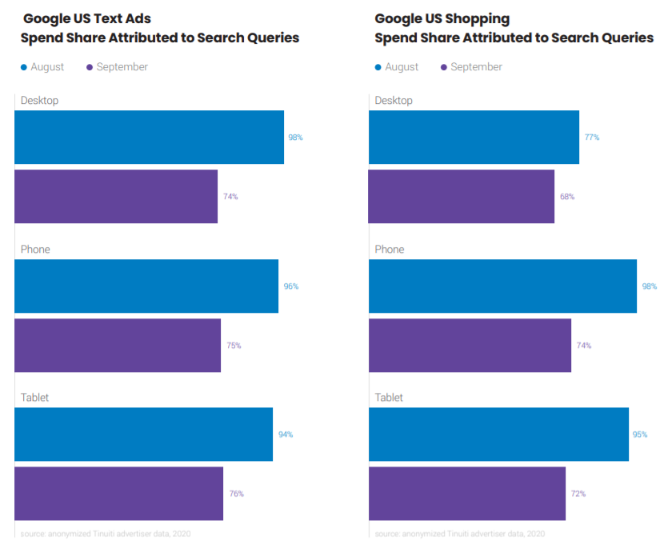
In August, shopping ads on desktop had only 77% of spend attributed to search queries wherein other device ad format saw at least 94% of spend reported. But By September, no device ad combination saw more than 76% of spend attributed in search terms reports.
Advertisers might be willing to tighten the match types which they use for text ad targeting. With regards to exact match keywords, the definition of close variants has eroded the boundaries of what kinds of queries might be considered exact matches.
The share of queries assigns as close variants went from accounting for 12% of exact match clicks in Q1 2016 to 41% in Q2 2020. Meanwhile, queries considered to be broad matches accounted for only 10% of paid search clicks in Q2 2020.
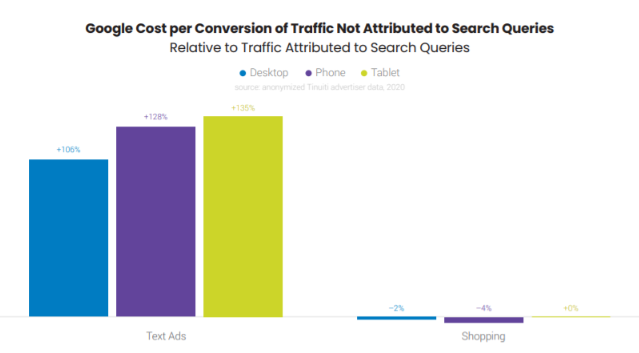
Given the rise of close variants over the last couple of years, advertisers have been dependent on search query reports to find poor matches and prevent them with negative keywords. Any limitations to how many queries are being reported is an obstacle to such control.
Google & Amazon: Hand in Hand to Drive Impression & Sales
After being away from Google shopping auctions for 12 weeks in Q1 & Q2, Amazon’s Google shopping impression share is back to its pre-pandemic level. During the prime day, Google Shopping advertisers saw sales more than double year over year on desktop, while phone sales increased 57%.
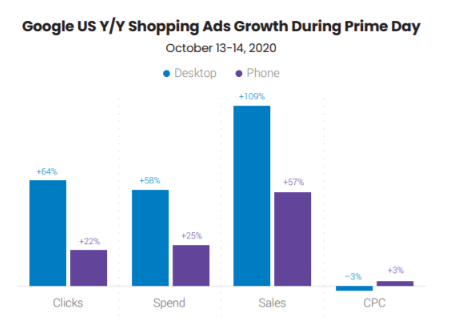
Amazon’s text ad impression share is started to ramp up towards the end of the quarter. Retailers found that sales attributed to text ads rose significantly on Prime Day, with desktop sales up 89% and phone sales up 62%.
Google Paid Search Spend: Elevated on All Device Types
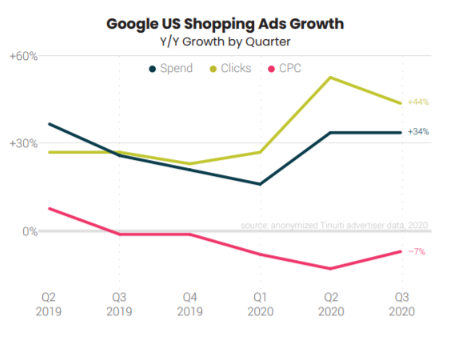
Google Shopping ads click growth slowed from 53% in Q2 to 44% in Q3, while CPC growth slowed from a 13% decline in Q2 to a 7% decline in Q3.
The share of total Google paid search spend for the median retailer increased across all three device types. The biggest jump occurred on phones, where Shopping went from 57% of spend in Q3 2019 to 61% in Q3 2020. Due to this, Newer Shopping formats like Local Inventory Ads and Showcase Shopping Ads were rolled out.
When smart shopping campaigns target the Google Display Network (GDN), the GDN accounted for 12% of spend attributed to these campaigns in Q3 2020. In some cases, it can top 50% of smart shopping spend.
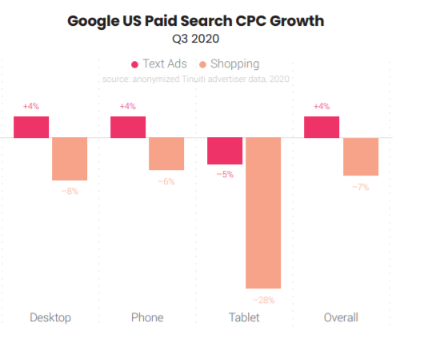
Google’s Text Ad & CPC Growth: Up 4% Year Over Year in Q3
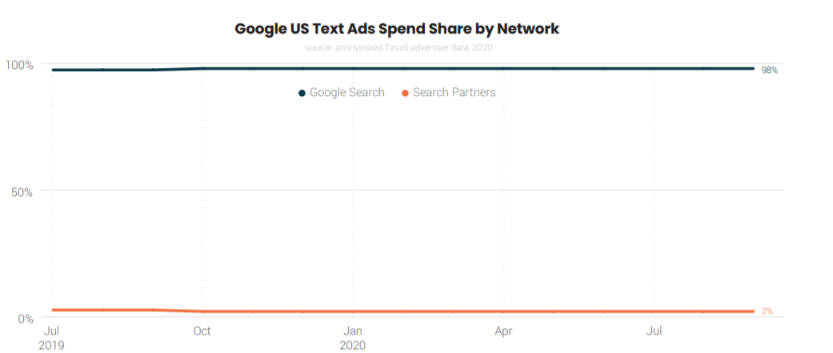
Compare to shopping, the search partner network is a bigger part of Google text ad spends but it still accounted for just 2.4% of spend in September 2020.
Click growth for text ads slowed from Q2 to Q3, going from 33% to 21%. Text ad CPC increased 4% year over year in Q3 following a 16% Q2 decline, as spend growth accelerated to 25% in Q3. Notably, CPC growth dropped from a 12% year-over-year increase in Q2 2019 to just 1% growth in Q3 2019, and the softer year-ago comparison likely played into the acceleration in CPC growth from Q2 to Q3 of 2020.
Once again, to view the full Google Ads benchmark report, download it here.
Related Links


Stop the wasted ad spend. Get more conversions from the same ad budget.
Our customers save over $16 Million per year on Google and Amazon Ads.